Delta Air Lines, Inc. DAL shares were trading lower Friday, cooling off after the company announced better-than-expected fourth-quarter financial results and issued guidance Thursday.
The company reported quarterly earnings of 22 cents per share, beating the estimate of 13 cents per share. Quarterly revenue of $9.47 billion, beating the estimate of $9.14 billion. Delta said it expects first-quarter revenue to recover to 72% to 76% of 2019 levels.
Delta was down 3.45% at $40.04 midday Friday.
See Related: Why Delta Air Lines Shares Are Taking Off Today
Delta Daily Chart Analysis
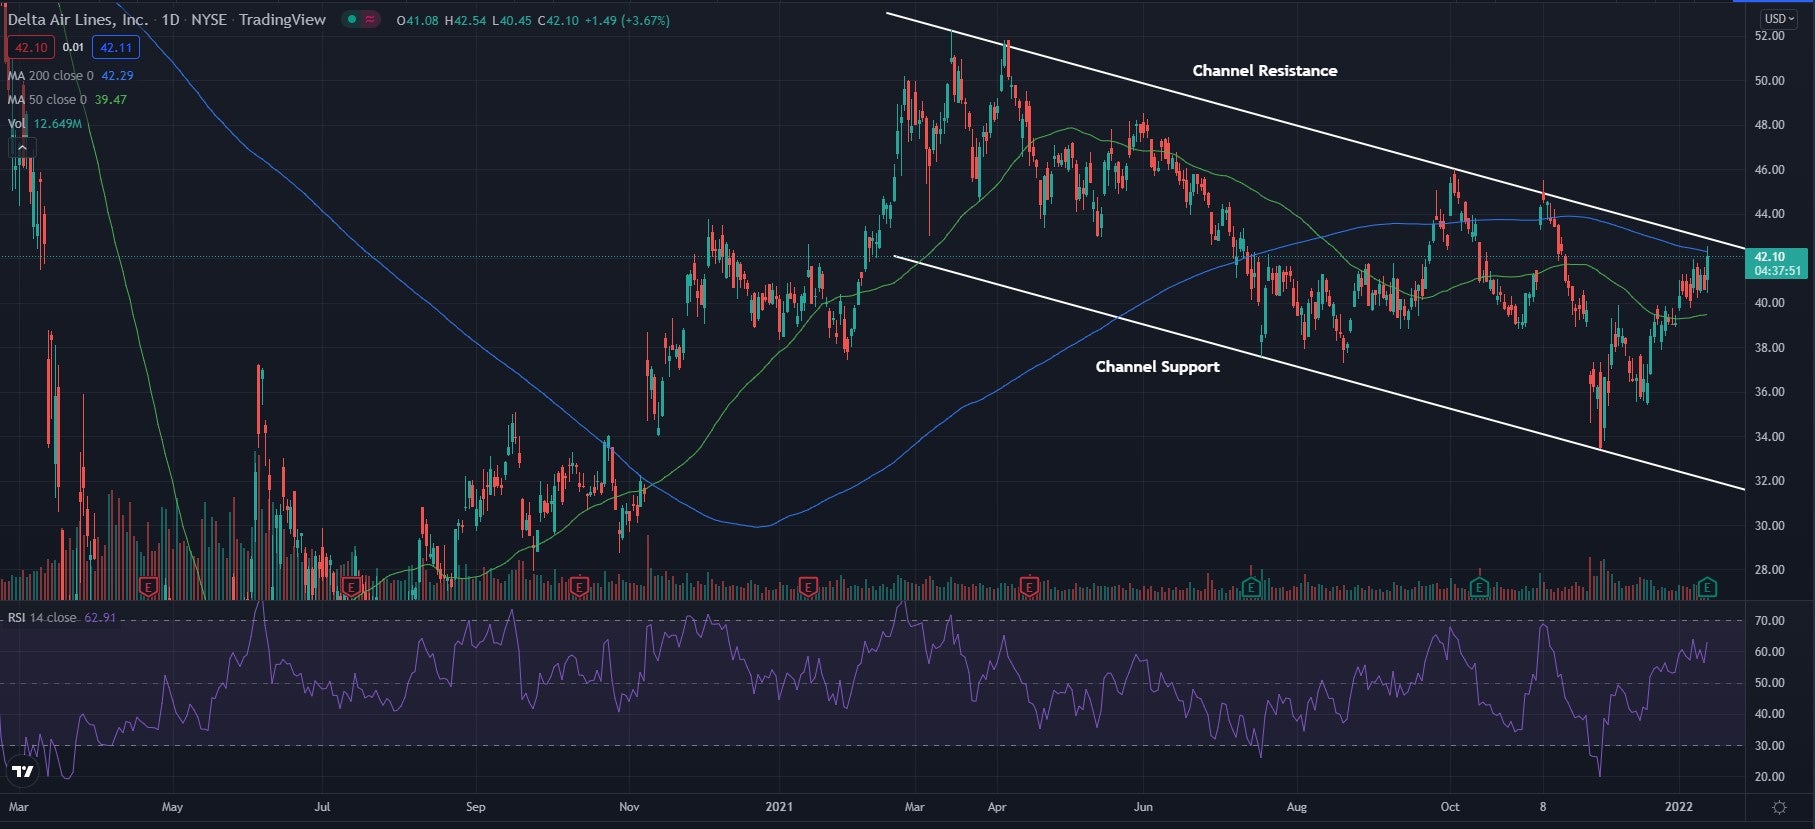
- Shares have climbed from support up to resistance in what traders call a downward channel. Connecting the highs and the lows of the chart shows the downward sloping channel with parallel support and resistance lines has formed. The stock is looking like it could see a breakout soon if it is able to cross above the channel resistance.
- The stock is trading above the 50-day moving average (green) but below the 200-day moving average (blue), indicating the stock looks to be consolidating. The 50-day moving average may hold as an area of support while the 200-day moving average may act as an area of resistance.
- The Relative Strength Index (RSI) has been forming higher lows and climbing for the past couple of months and sits at 62. This shows that buyers have been entering the market once again and that there is now more buying pressure than selling pressure in the stock.

What's Next For Delta Airlines?
Delta Airlines has been making a comeback and could start another bullish trend if it is able to push past resistance. If unable to cross back above resistance the price could start falling back toward support as it has in the past.
Bulls are looking to see the break of resistance and for the price to continue to push higher, also crossing above the 200-day moving average. Bears are looking to see the stock get rejected at the resistance level and start to fall back lower toward the pattern support once again and drop back below the 50-day moving average.
© 2025 Benzinga.com. Benzinga does not provide investment advice. All rights reserved.
Trade confidently with insights and alerts from analyst ratings, free reports and breaking news that affects the stocks you care about.