Exxon Mobil Corp. XOM shares are trading higher Tuesday after the company reported better-than-expected fourth-quarter EPS results. The company reported $2.08 earnings per share, beating the $1.89 estimate. Sales came in at $84.97 billion, missing the $91.28 billion estimate. The company also initiated a $10 billion buyback.
Exxon Mobil was up 5.2% at $79.96 at publication time.
See Also: Chart Wars: Will Exxon Or Chevron Stock Run Back To Blue Skies First?
Exxon Mobil Daily Chart Analysis
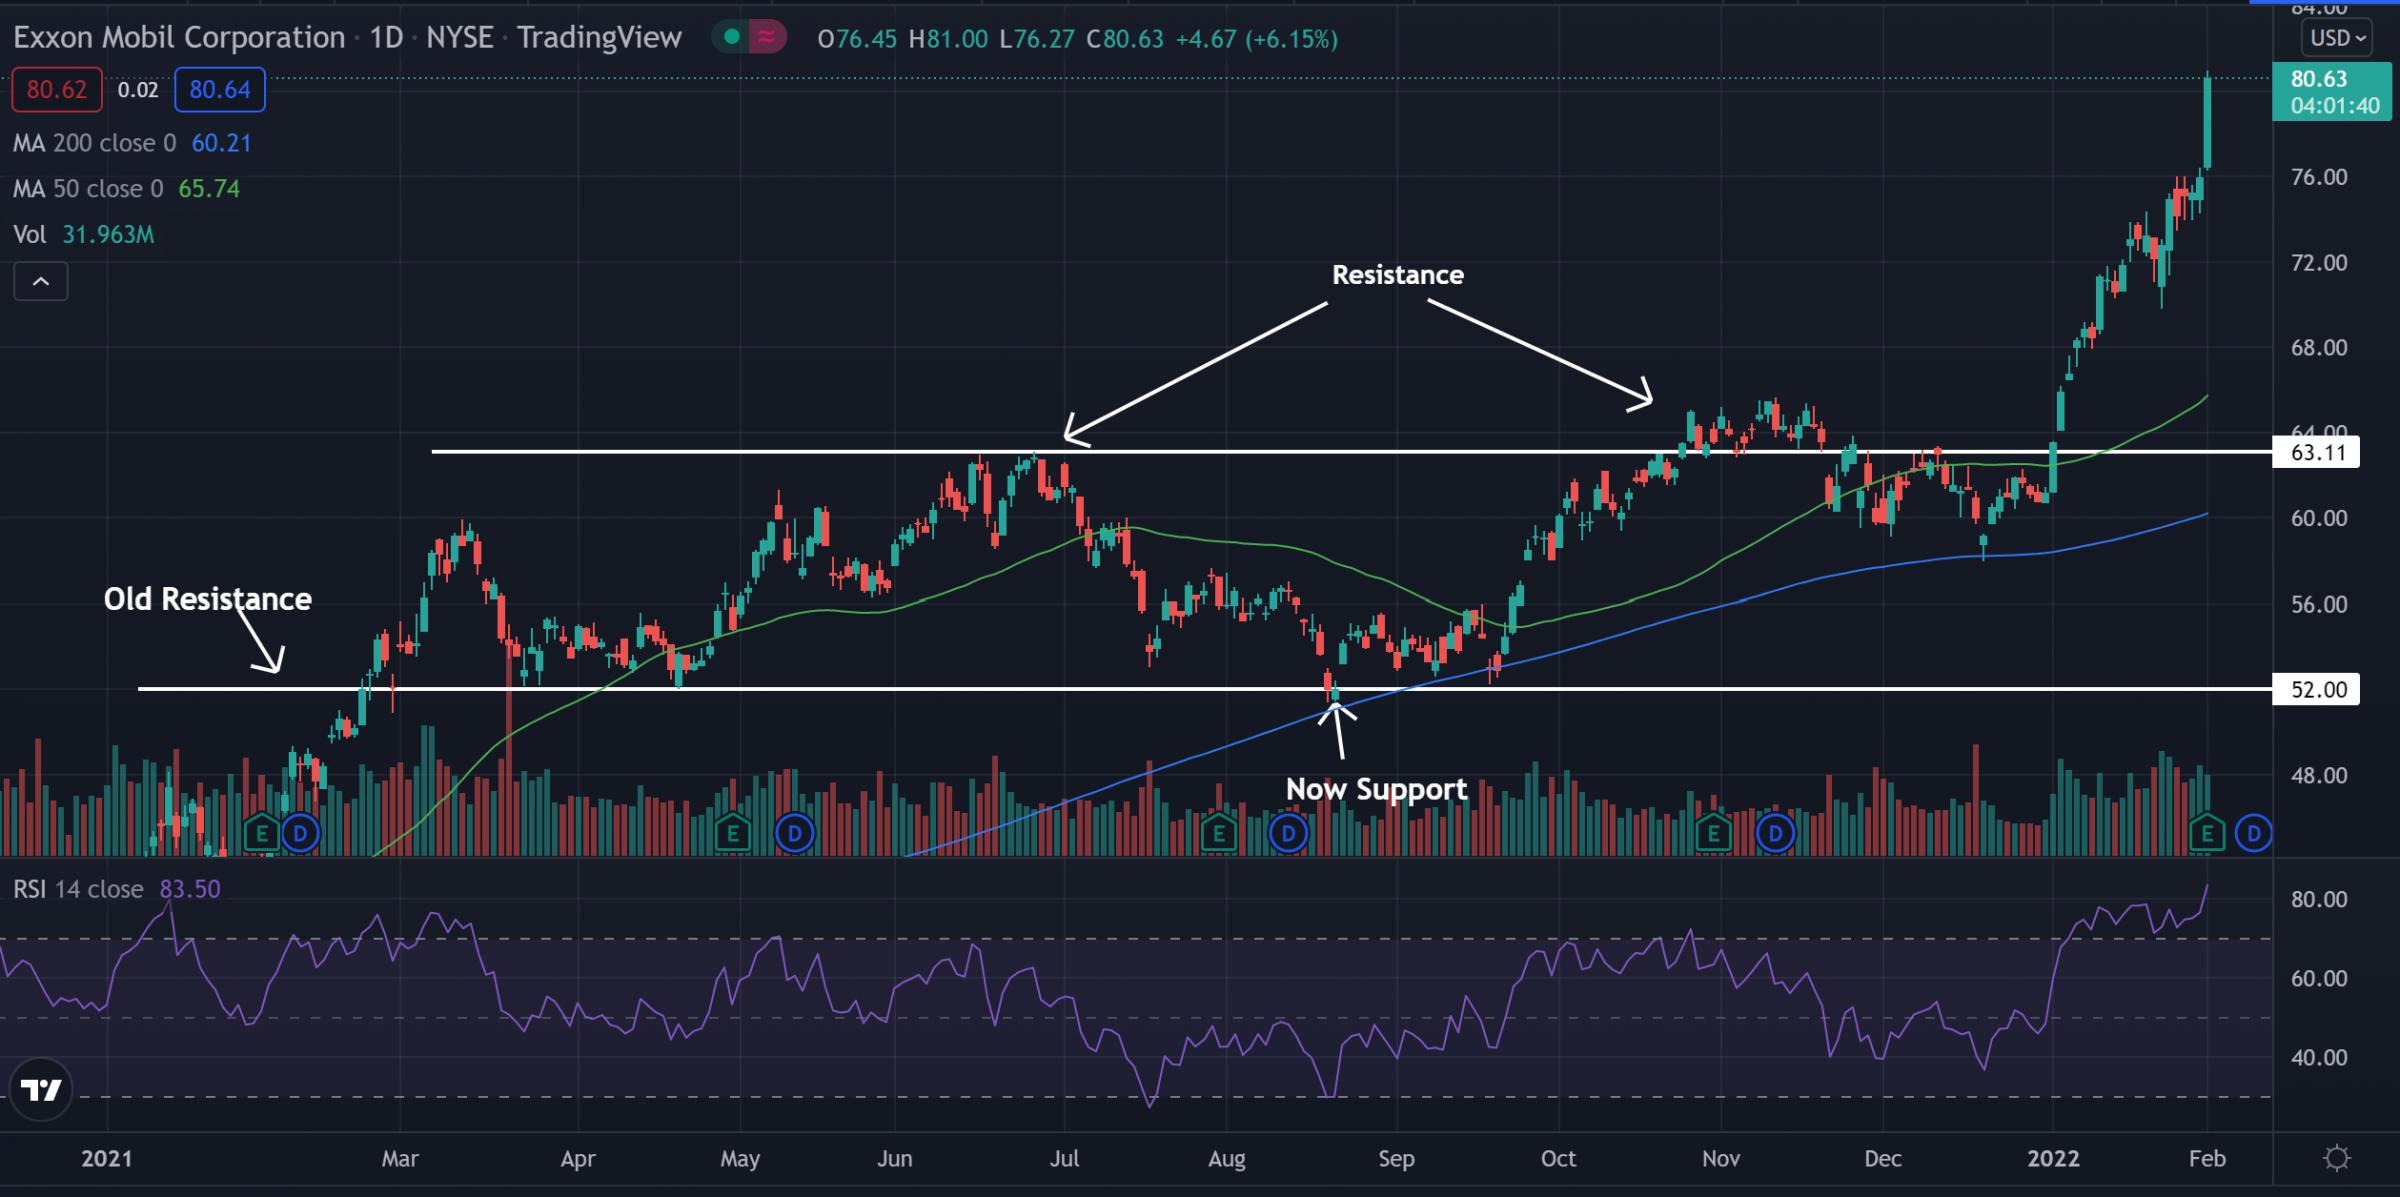
- The stock broke above the $63 resistance level, out of a sideways channel and has been flying. The $52 level held as support while the $63 level was holding as resistance. Now that the price is above the $63 level, it may hold as an area of support.
- The stock trades above both the 50-day moving average (green) and crossed above the 200-day moving average (blue). This indicates the sentiment is turning bullish, and each of these moving averages may hold as an area of support in the future.
- The Relative Strength Index (RSI) has been flying higher and now sits at 83. This shows buyers have been moving into the stock and have been pushing it higher since the break of resistance. The RSI is well into the overbought range and if it can stay in this area, the price may continue to rise.

What’s Next For Exxon Mobil?
Exxon Mobil is seeing a strong period of bullish momentum as it has broken resistance and has been flying higher since the break. If the RSI stays in the overbought range and the price stays above the moving averages, the price may continue to rise.
Bullish traders want to see this as well as the stock forming higher lows so it has a healthy climb higher. Bearish traders want to see the price begin to fall and break below the moving averages and the $63 level once again.
Edge Rankings
Price Trend
© 2025 Benzinga.com. Benzinga does not provide investment advice. All rights reserved.
Trade confidently with insights and alerts from analyst ratings, free reports and breaking news that affects the stocks you care about.