Zinger Key Points
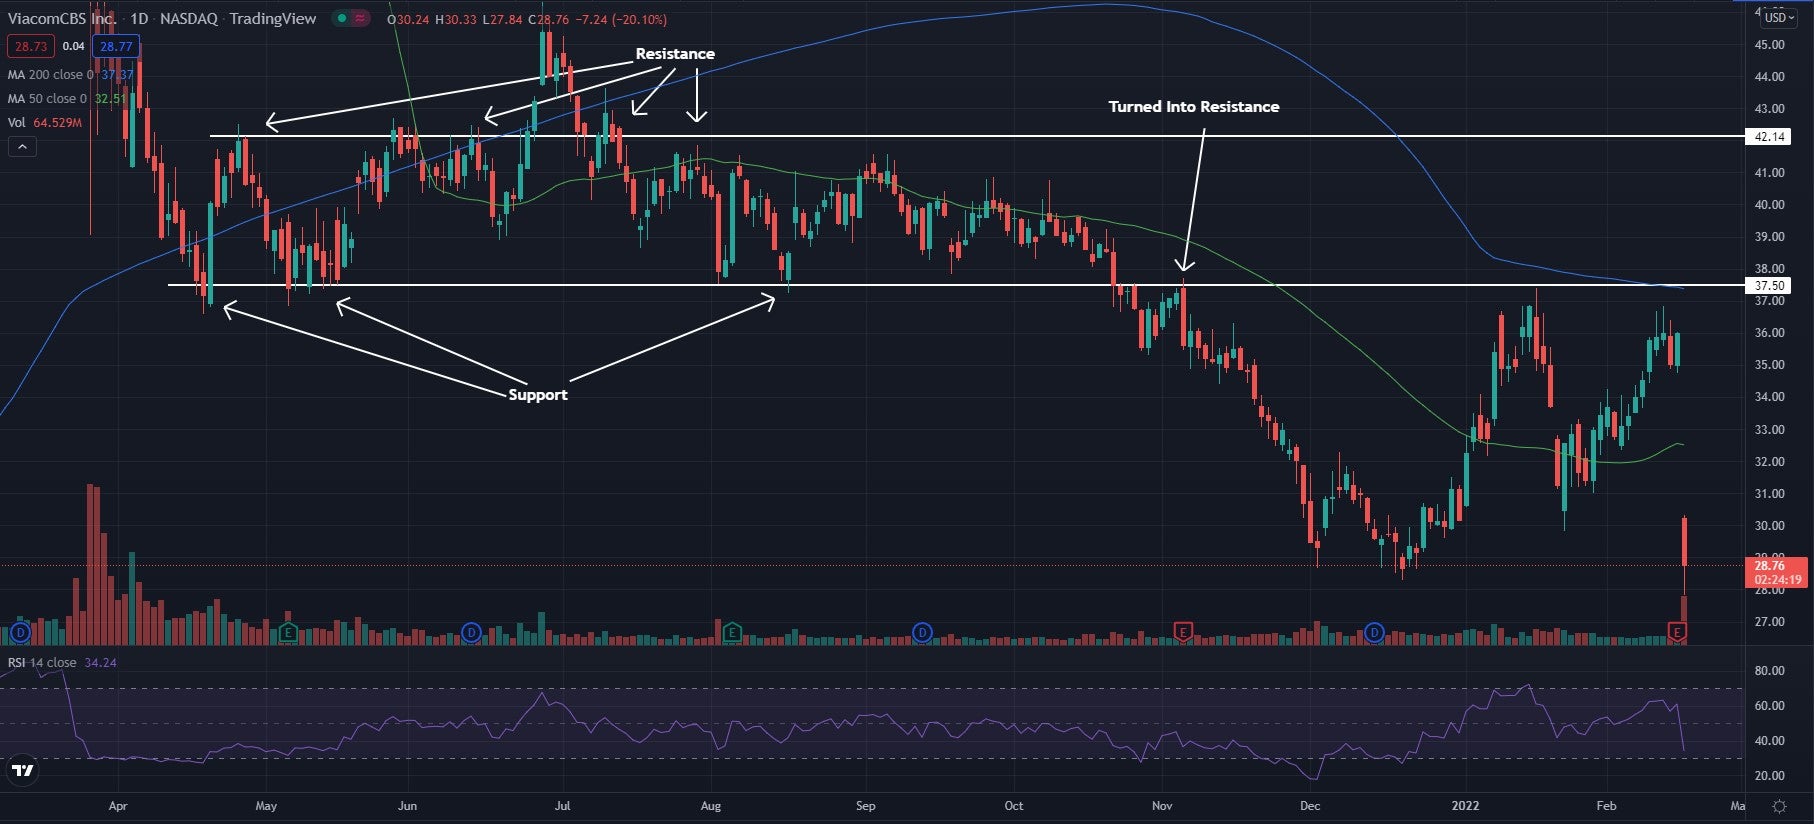
- ViacomCBS is trading below both the 50-day moving average and the 200-day moving average, which indicates bearish sentiment.
- The Relative Strength Index saw a steep drop Wednesday and now sits at 34, showing that more sellers have entered into the stock.
- Feel unsure about the market’s next move? Copy trade alerts from Matt Maley—a Wall Street veteran who consistently finds profits in volatile markets. Claim your 7-day free trial now.
ViacomCBS Inc. VIAC shares are trading lower Wednesday after the company reported fourth-quarter adjusted EPS results were down year-over-year.
ViacomCBS reported quarterly earnings of 26 cents per share, representing a 75% decrease over earnings of $1.04 per share from the same period last year. The company reported quarterly sales of $8 billion, which beat the analyst consensus estimate of $7.49 billion by 7%.
ViacomCBS was down 19.59% at $28.94 at publication time.
Related: ViacomCBS Rebrands As Paramount: What You Need To Know
ViacomCBS Daily Chart Analysis
- The stock looked to be approaching an old channel where it once traded as it neared previous support, which is now likely an area of resistance, but earnings were the catalyst for a dramatic drop lower. VIAC may now have started a strong downward trend and will need many buyers to enter the stock once again for it to return to yesterday's levels.
- Shares are trading below both the 50-day moving average (green) and the 200-day moving average (blue). This indicates bearish sentiment, and each of these moving averages may hold as an area of resistance in the future.
- The Relative Strength Index (RSI) saw a steep drop Wednesday morning and now sits at 34. This shows many sellers have entered into the stock as it nears the oversold region. If the RSI falls below the 30 level and enters into the oversold region, the stock price may continue to fall and trend lower.

What’s Next For ViacomCBS?
The weak earnings were a couple steps back for the company as it is falling to the lows of December 2021. The stock will need to start to form higher lows for a possible reversal back toward resistance.
Bullish traders are looking for these higher lows and then want to see the stock cross above the moving averages.
Bearish traders look to be in control of the stock as it sits and are looking to see the stock continue trading lower and to create lower highs along the way.
Photo: Courtesy of Diverse Stock Photos on Flickr
© 2025 Benzinga.com. Benzinga does not provide investment advice. All rights reserved.
Trade confidently with insights and alerts from analyst ratings, free reports and breaking news that affects the stocks you care about.