Zinger Key Points
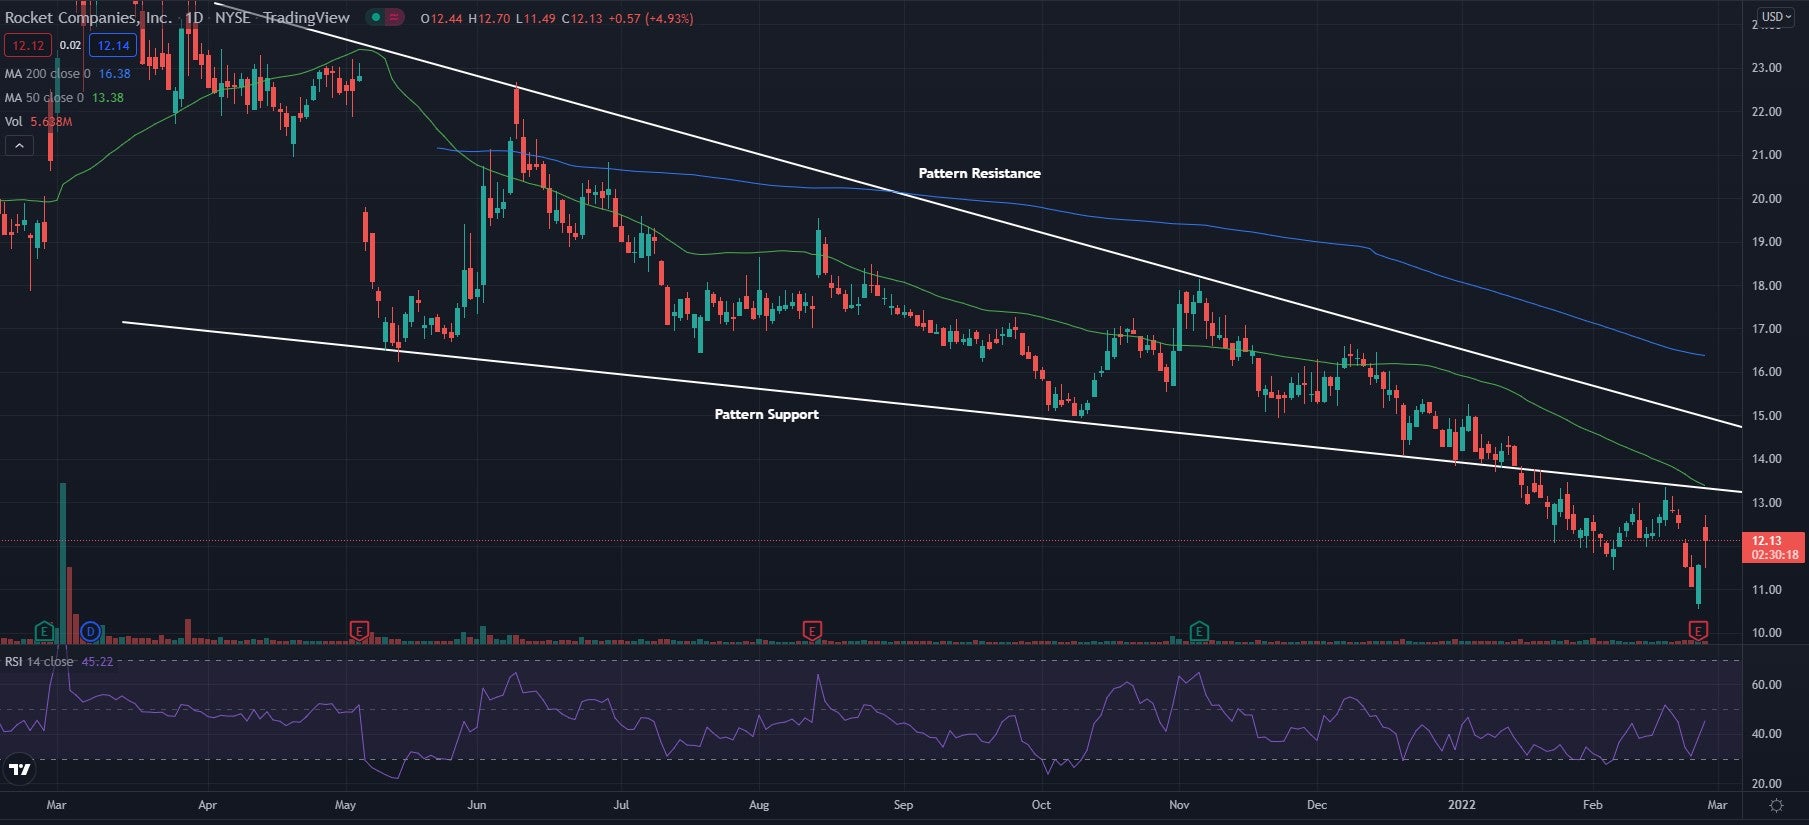
- Shares fell below support in the falling wedge pattern and went on to test the area again as resistance.
- The stock trades below both the 50-day moving average (green) and the 200-day moving average (blue).
- Feel unsure about the market’s next move? Copy trade alerts from Matt Maley—a Wall Street veteran who consistently finds profits in volatile markets. Claim your 7-day free trial now.
Rocket Companies Inc. RKT shares were trading higher Friday, bouncing back after the company reported worse-than-expected fourth-quarter EPS and sales results. The company reported earnings per share of 32 cents, missing the estimate of 37 cents. Sales came in at $2.44 billion, missing the estimate of $2.63 billion.
Rocket Companies was up 3.29% at $11.93 Friday afternoon.
See Also: Rocket Companies CEO Highlights Strong Mortgage Business: 'But We're So Much More Than That'
Rocket Companies Daily Chart Analysis
- Shares fell below support in the falling wedge pattern and went on to test the area again as resistance. The price has fallen since the retest of the pattern’s level. The price now looks as though it is attempting to test the area once again.
- The stock trades below both the 50-day moving average (green) and the 200-day moving average (blue). This indicates bearish sentiment, and each of these moving averages may hold as an area of resistance in the future.
- The Relative Strength Index (RSI) saw a push higher Friday and now sits at 45. This shows that more buyers have entered the market although there still remain more sellers overall in the market. The RSI crossing above the middle line and being able to hold above the line is a sign that the stock may be beginning to see a reversal.

What’s Next For Rocket Companies?
Rocket needs to reclaim this support level for it to see a possible reversal. If unable to cross the support level, it may be ready for a strong bearish move in the future.
Bears were excited to see the stock hold the support level as an area of resistance. Bears are in control of the stock as it sits.
Bullish traders were excited to see the RSI start climbing. They would like to see the RSI continue to climb and cross the middle to show there are more buyers in the market overall. More buyers in the market may signal a reversal is coming, but until then the stock will likely continue to trend lower.
Edge Rankings
Price Trend
© 2025 Benzinga.com. Benzinga does not provide investment advice. All rights reserved.
Trade confidently with insights and alerts from analyst ratings, free reports and breaking news that affects the stocks you care about.