


(Friday Market Open) The much-awaited June Unemployment Situation report finally arrived this morning but judging from the immediate downturn in S&P 500 futures, investors didn’t get what they wanted.
Potential Market Movers
In June, the economy added 372,000 jobs last month, well above the estimate of 268,000. Average hourly wages came in as expected but were lower than the previous month and the unemployment rate stayed at 3.6%.
The takeaway? There’s little in today’s numbers to suggest that the Federal Reserve will curtail its present plans for aggressive rate hikes to curb inflation. In fact, the 10-year Treasury yield (TNX) traded higher on the news, indicating that bond buyers are expecting more rate increases as well.
The one negative item in the jobs report was the participation rate. It fell during June, which suggests that some workers aren’t seeing the incentives they need to stay in the workforce. This may be due to wages not keeping up with inflation.
Meanwhile, Elon Musk’s deal to buy Twitter TWTR appears to be in jeopardy due to the inability of Musk’s team to confirm figures on spam accounts, according to The Washington Post. These numbers matter for their impact on Twitter’s ability to sell advertising on their platform. Twitter’s management team has been unable or unwilling to provide the “real” number, the Post says, which has caused Musk to pause his $44 billion deal.
While the Twitter deal is in limbo, Elon Musk’s Tesla (NASDAQ: TSLA) reported that its China shipments have set a record as its China plant opened back up from the country’s COVID-19 restrictions. Tesla shipped 78,906 vehicles last month which was more than double than the 33,155 in the same period a year ago.
General Motors GM hasn’t been able to keep pace with Tesla selling vehicles within China, the biggest automotive market in the world. GM saw its vehicle sales fall 35.5% in June year-over-year (YOY) in China while Tesla reported a decrease of 18%. GM reported that its auto sales has fallen due to shortage in computer chips and due to continued Chinese pandemic lockdowns.
Mastercard SpendingPulse, which measures in-store and online retail sales for types of payments, U.S. consumer retail spending rose 9.5% YOY when excluding auto sales. Sales grew 6.1% YOY when excluding autos and gas. However, the numbers aren’t adjusted for inflation which means much of the growth could be due to higher prices. The report showed that investors are also getting out to brick-and-mortar stores with in-store spending rising 11.7% from the year-ago period, while e-commerce rose just 1.1% over the same timeframe.
Levi Strauss LEVI appears to be ringing up some of those sales because the company beat on top- and bottom-line numbers after the market close on Thursday. The news prompted the stocks to rally more than 4% in pre-market trading.
However, WD-40 WDFC missed on earnings and revenues causing the stock to plummet 9.7% ahead of the opening bell.
Costco COST appears to be benefiting from consumers heading out to shop for cheaper alternatives for things they need, because its June sales report came in higher-than-expected. Even when removing its increase in gas sales, Costco still experienced an increase in same store sales. COST was up 0.80% in premarket action.
Consumers could be sticking to cash as consumer finance company Upstart (UPST) fell 17% in pre-market action after releasing its preliminary revenue estimates that were below analysts’ expectations.
Reviewing the Market Minutes
Stocks gained on Thursday led by the Nasdaq ($COMP), which shot up 2.28% on the strength of a semiconductor rally that took the PHLX Semiconductor Index (SOX) higher by 4.48%. Samsung provided a big boost to the group after reporting an 11% increase in profits and a 21% jump in revenue due to strong sales of memory chips. Advanced Micro Devices (AMD) and Qualcomm (QCOM) respectively traded more than 5% higher on the news.
Yesterday’s rally was sparked by weakness in the red-hot jobs market. Early in the session, the Challenger Jobs Cuts report noted a significant increase in corporate layoffs and U.S. initial jobless claims came in at their highest level since January. The weakness in these numbers gave investors reason to believe that the Fed might not need to be as aggressive in their rate hikes later this month.
The S&P 500 (SPX) and the Dow Jones Industrial Average ($DJI) closed 1.5% and 1.1% higher on the day. Unlike previous rallies this week, there was some breadth to these gains as the NYSE advancers outpaced decliners by more than 3-to-1. In fact, the Russell 2000 (RUT) small-cap index climbed 2.43%, further reflecting this direction.
All sectors except utilities were positive on the day with energy finishing on top. The Energy Select Sector Index rose 3.56% on a rebound in energy prices. WTI crude oil futures, natural gas futures, and unleaded gasoline futures settled 4%, 13.6%, and 7% higher for the trading session.
The 10-year Treasury yield (TNX) also continued its upward climb, rising another 10 basis points to 3.01%. However, the 2-year Treasury yield rose 9 basis points to 3.03%, keeping the 2s10s spread inverted for the third day in a row.
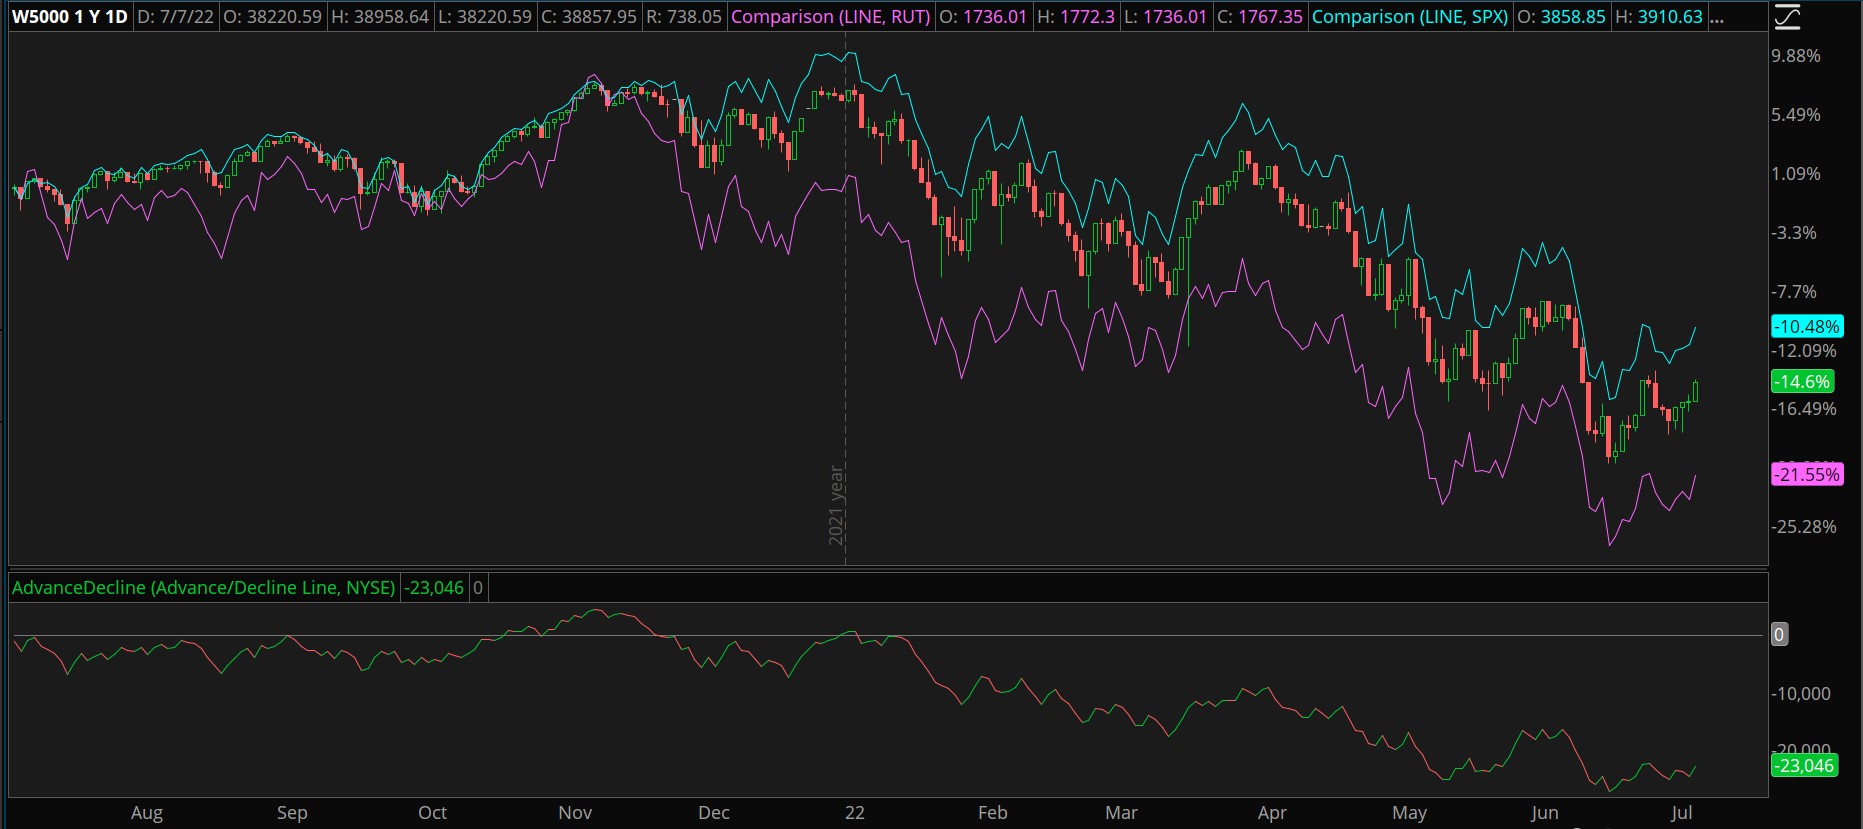
CHART OF THE DAY: SLICE OF BREADTH. The Wilshire 5000 Total Market Index (W5000—candlesticks) has fallen more than 14% in the last 12 months which exceeds the S&P 500’s (SPX—blue) 10% drop. Meanwhile, the Russell 2000 (RUT—pink) has lost 21% over the same period. These three indexes show how broad the bear market has been, confirmed by the NYSE Advance/Decline Line (green/red). Data Sources: ICE, S&P Dow Jones Indices. Chart source: The thinkorswim® platform. For illustrative purposes only. Past performance does not guarantee future results.
Three Things to Watch
Breadth & Circuses: When looking for a market bottom, it’s easy to get caught up in day-to-day market gyrations and financial headlines that so often get blown up past their actual importance. It’s why analyzing market breadth can help long-term investors determine whether or not a change is taking place.
Before the S&P 500 (SPX) started downtrending at the beginning of the year, the NYSE advance/decline line and the Russell 2000 (RUT) had already begun to head lower. This is because a “flight to quality” often precedes a market downtrend. Many investors were actually moving into blue chip and large- and mega-cap stocks that historically have better withstood market downturns.
Risk On: Here’s another good reason to watch market breadth—market bottoms can form when greater market breadth emerges. By that point, many investors are willing to take on more risk by turning to smaller companies like those in the Russell 2000. A bear market and/or recession will often shake out smaller companies that weren’t being managed well or lacked a product or service that consumers valued. Those that remain are usually lean and mean and ready for growth when the economy turns around. Watching smaller company stocks through a downturn is one of many factors when trying to identify a market bottom.
Highs & Lows: Another commonly used breadth indicator is comparing the number of stocks that are creating new highs versus ones creating new lows. Throughout June, the NYSE reported that the number of stocks reaching new three-month highs versus those making new three-month lows have been as wide as 60 to 1,150. By July 5, the ratio was about 22 to 215. Since the beginning of the year, the number of stocks reaching new three-month lows have greatly outpaced the number reaching new highs and currently there’s no sign of a change.
Judging by the new highs and lows, the advance/decline line, and the trends of Wilshire 5000, S&P 500, and the Russell 2000, breadth appears to still be fairly weak. So, keep watching.
Notable Calendar Items
July 12: Earnings from PepsiCo PEP
July 13: June Consumer Price Index (CPI) and earnings from Progressive PGR, Fastenal FAST, and Delta Air Lines DAL
July 14: Producer Price Index (PPI) and earnings from Taiwan Semiconductor TSM, JPMorgan Chase JPM, Morgan Stanley MS, Cintas CTAS, and ConAgra CAG
July 15: Retail sales and earnings from UnitedHealth UNH, Wells Fargo WFC, BlackRock BLK, Citigroup C, and U.S. Bank USB.
July 18: Earnings from Bank of America BAC, IBM IBM, and Goldman Sachs GS
TD Ameritrade® commentary for educational purposes only. Member SIPC.
Image sourced from Shutterstock
This post contains sponsored advertising content. This content is for informational purposes only and not intended to be investing advice.
Edge Rankings
Price Trend
© 2025 Benzinga.com. Benzinga does not provide investment advice. All rights reserved.
Trade confidently with insights and alerts from analyst ratings, free reports and breaking news that affects the stocks you care about.

