Zinger Key Points
- Analysts expect Netflix to report earnings per share of $2.13 on revenues of $7.84 billion.
- Bullish traders want to see the streaming-giant break up bullishly from a long-term sideways pattern.
- Pelosi’s latest AI pick skyrocketed 169% in just one month. Click here to discover the next stock our government trade tracker is spotlighting—before it takes off.
Netflix, Inc NFLX will kick off big tech earnings on Tuesday when it prints its third-quarter financial results after the market close.
The heavily beaten-down stock spiked up in the morning trading session but fell in tandem with the general markets heading into the event to trade slightly lower.
When the streaming giant printed its second-quarter results on July 19, the stock was trading sideways, but the earnings release caused Netflix to break bullishly into an uptrend.
For the second quarter, Netflix reported earnings per share of $3.20, beating the Street estimate of $2.96. The company reported revenues of $7.97 billion, which missed the $8.04-billion consensus estimate.
Although Netflix missed the Street’s estimate of revenue, the stock climbed over the days that followed because while the company had guided to lose 2 million subscribers during the quarter, Netflix reported a loss of 970,000.
For the third quarter, analysts expect Netflix to report earnings per share of $2.13 on revenues of $7.84 billion. Traders and investors will be watching closely to see whether Netflix has been able to retain more of its client base and gain additional users.
From a technical analysis perspective, Netlix’s stock looks neutral heading into the event, needing Tuesday’s after-market candle to determine a direction.
It should be noted that holding stocks or options over an earnings print is akin to gambling because stocks can react bullishly to an earnings miss and bearishly to an earnings beat.
Options traders, particularly those who are holding close dated calls or puts, take on extra risk because the institutions writing the options increase premiums to account for implied volatility.
Want direct analysis? Find me in the BZ Pro lounge! Click here for a free trial.
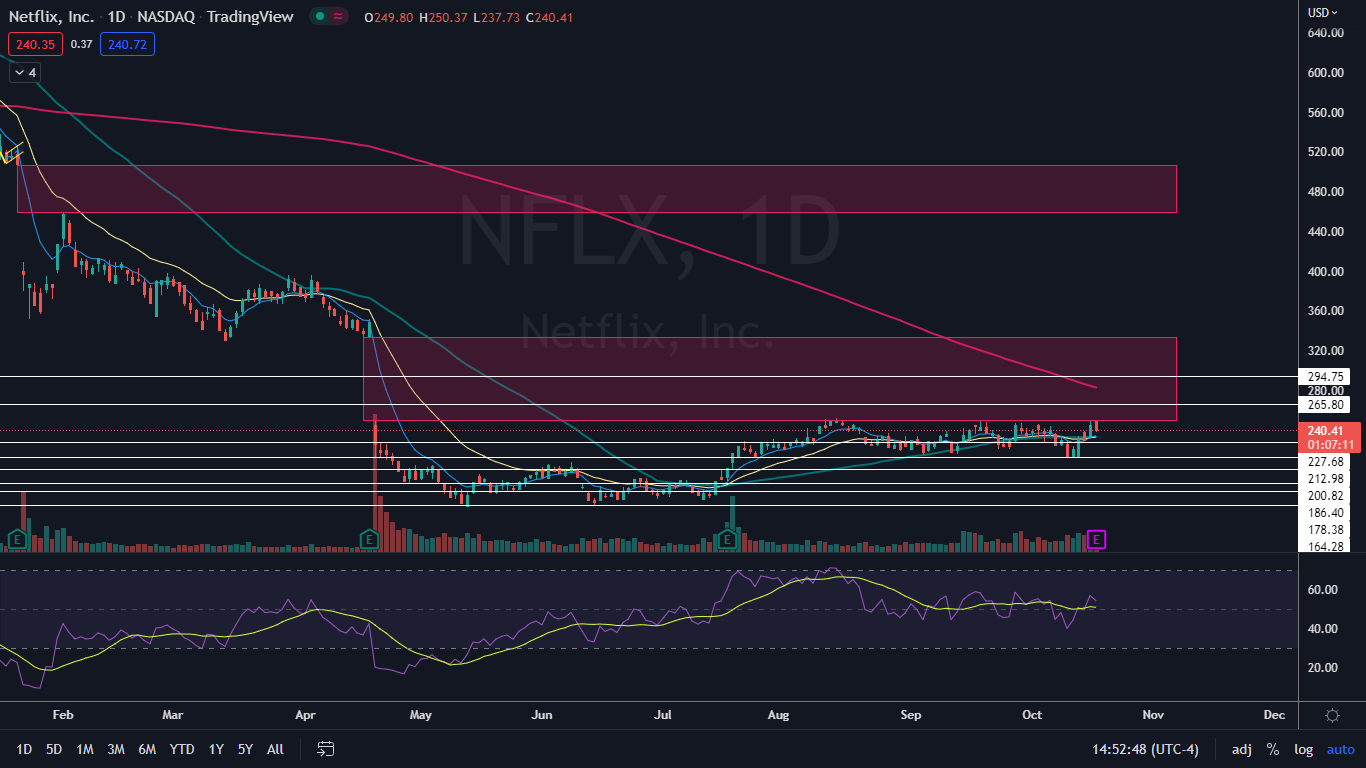
The Netflix Chart: Netflix has been trading mostly sideways since Aug. 15, between about $211 and $250. Within the horizontal pattern, Netflix reversed course into an uptrend on Oct. 13 and has printed a series of higher highs and higher lows on the four-hour chart.
- On the daily chart, Netflix hasn’t yet confirmed an uptrend by printing a higher low above $211. If Netflix falls following the earnings print, bullish traders will want to see the stock bounce up off that level, while bearish traders will want to see a loss of the area, which will negate the possible uptrend and set the stock into a likely downtrend.
- There’s a possibility Netflix printed a bearish double top pattern on Monday when the stock rose up to the $250 mark and rejected the level as resistance. Netflix also rejected the area on Sept. 20.
- If Netflix receives a bullish reaction to the earnings print, bullish traders will want to see the stock soar firmly into the upper gap that exists between about $248 and $333. Bearish traders can watch for Netflix to reject the 200-day simple moving average as resistance if the stock moves upward.
- Netflix has resistance above at $265.80 and $294.75 and support below at $227.68 and $212.98.

Photo via Shutterstock.
Edge Rankings
Price Trend
© 2025 Benzinga.com. Benzinga does not provide investment advice. All rights reserved.
Trade confidently with insights and alerts from analyst ratings, free reports and breaking news that affects the stocks you care about.