


Zinger Key Points
- UPS prints third-quarter earnings of $2.99 per share on revenues of $24.2 billion.
- The stock is trading in a confirmed uptrend, making higher highs and higher lows.
- Feel unsure about the market’s next move? Copy trade alerts from Matt Maley—a Wall Street veteran who consistently finds profits in volatile markets. Claim your 7-day free trial now.
United Parcel Service, Inc. UPS gapped up about 2.5% to start Tuesday’s trading session after printing mixed third-quarter earnings.
The news prompted Jefferies analyst Stephanie Moore to initiate coverage on UPS with a Buy rating. Moore announced a price target of $190.
UPS reported quarterly adjusted earnings of $2.99 per share, beating the consensus estimate of $2.87 per share. The company reported third-quarter revenue increased 4.2% year-over-year to $24.2 billion, which missed the $24.42-billion consensus estimate.
The company reaffirmed its revenue guidance of approximately $102 billion for the full year 2022.
UPS said its earnings results were up 10.3% year-over-year, which showed strength in comparison to FedEx Corporation FDX. When FedEx printed its first-quarter earnings on Sept. 15, the company reported EPS of $3.44 compared to $4.37 in the year-ago period.
UPS was struggling to hold onto its gains Tuesday, and by late morning the stock had completely filled the lower gap. Tuesday’s high-of-day may end up being the next higher high within an uptrend pattern, and a retracement could provide traders who aren’t in a position with a solid entry if the trend holds.
Want direct analysis? Find me in the BZ Pro lounge! Click here for a free trial.
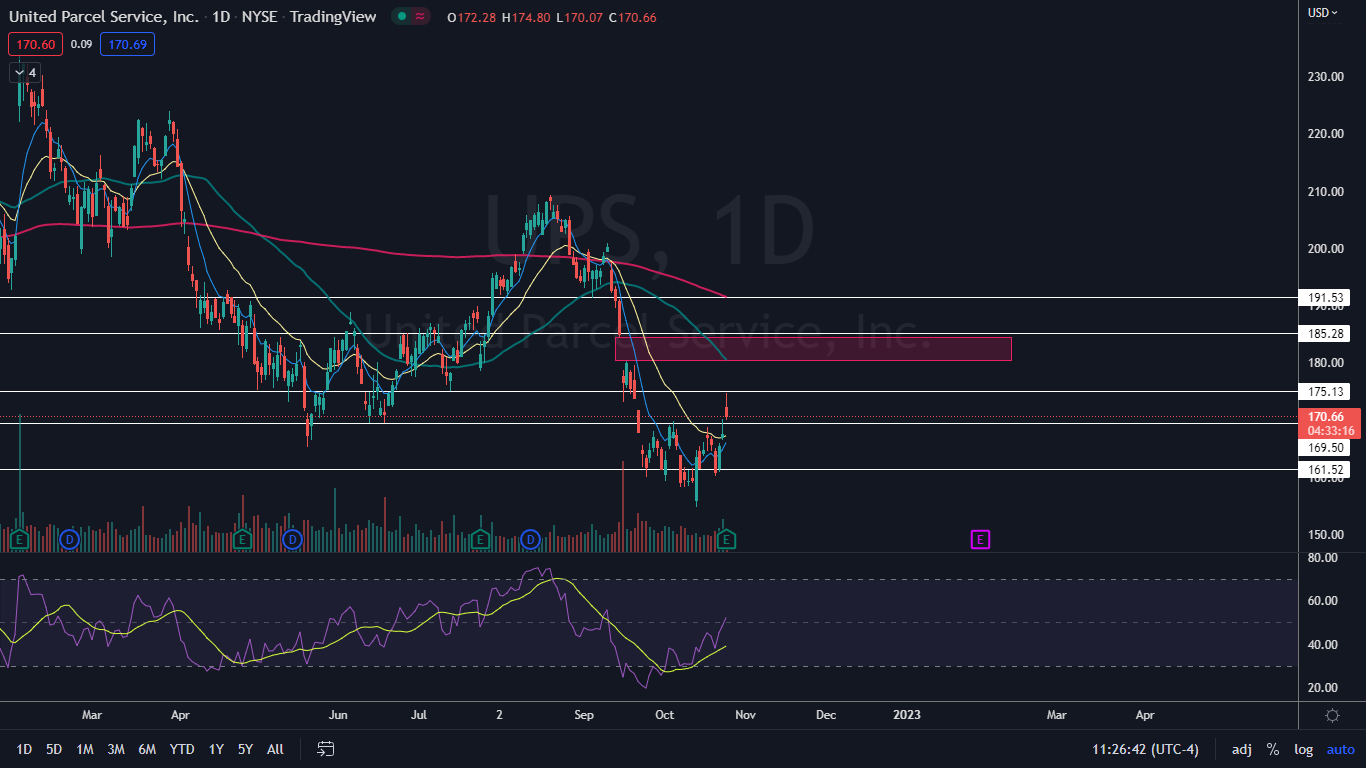
The UPS Chart: UPS reversed into an uptrend on Oct. 13 after hitting a new 52-week low of $154.87. The stock formed its most recent higher low on Oct. 20 and $160.32 and the most recent higher high was printed at the $174.80 mark on Tuesday.
- If UPS closes the trading day flat or near the low-of-day, the stock will print a doji or shooting star candlestick, respectively, which could signal lower prices will come on Wednesday. If that happens, bullish traders can watch for the stock to print a bullish reversal candlestick above the $161 mark.
- If UPS rebounds to close the trading session near the high-of-day, the stock will print a hammer candlestick, which could indicate higher prices are in the cards. The second most likely scenario, in that case, is that UPS will trade sideways to consolidate.
- There’s a gap above on the UPS chart between $180.40 and $184.58 that was created on Sept. 16. Gaps on charts fill about 90% of the time, which makes it likely UPS will rise up to fill the empty trading range in the future.
- UPS has resistance above at $175.13 and $185.28 and support below at $169.50 and $161.52.
 See Also: UPS Posts Mixed Bag Q3 Earnings On Higher Delivery Prices; Sticks To Annual Guidance
Photo: Courtesy UPS
Edge Rankings
Price Trend
© 2025 Benzinga.com. Benzinga does not provide investment advice. All rights reserved.
Trade confidently with insights and alerts from analyst ratings, free reports and breaking news that affects the stocks you care about.

