Zinger Key Points
- Analysts expect the company to report EPS of 96 cents on revenues of $6.82 billion.
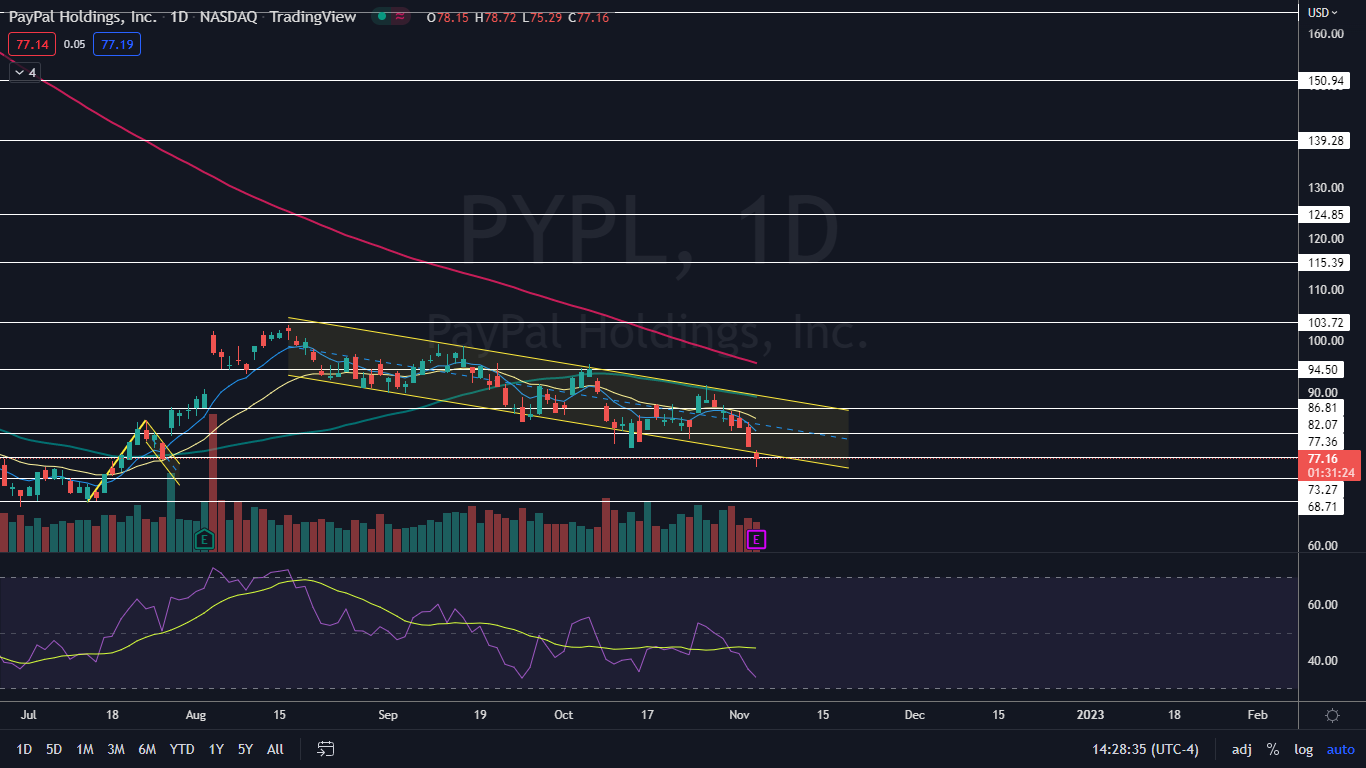
- PayPal gapped down Thursday to trade under a long-term falling channel pattern.
- Feel unsure about the market’s next move? Copy trade alerts from Matt Maley—a Wall Street veteran who consistently finds profits in volatile markets. Claim your 7-day free trial now.
PayPal Holdings, Inc PYPL is set to print its third-quarter financial results after the markets close on Thursday. Analysts expect the company to report EPS of 96 cents on revenues of $6.82 billion for the quarter ending Sept. 30.
Ahead of the earnings print, Morgan Stanley analyst James Faucette maintained an Overweight rating on PayPal and bumped the price target up by $1, from $134 to $135. The new price target suggests 75% upside for the stock.
When PayPal printed its second-quarter earnings report on Aug. 2, the stock gapped up 12.82% the following day but ran into a group of sellers who caused the stock to close up about 8.5% on the day.
From a technical perspective, PayPal looks set to bounce due to several bullish signals that have developed on the stock’s chart. Of course, holding a position in a stock over earnings can be akin to gambling, as stocks can rise following an earnings miss and fall after reporting a beat.
Want direct analysis? Find me in the BZ Pro lounge! Click here for a free trial.
The PayPal Chart: PayPal gapped down to open Thursday’s session, which caused the stock to lose support at the lower trend line of a falling channel pattern. PayPal has been trading in a falling channel since Aug. 16, making a fairly consistent series of lower lows and lower highs.
- PayPal’s most recent lower high within the downtrend was printed at $91.34 on Oct. 26 and the most recent confirmed low was was formed at the $80.86 mark two days prior. On Wednesday, PayPal fell under that low and continued to trend lower Thursday.
- PayPal was working to print a hammer candlestick on the daily chart, which may indicate the next lower low has occurred and the stock will bounce higher on Friday. If that occurs, PayPal will regain support within the channel.
- If PayPal is eventually able to break up bullishly from the falling channel, it could signal a larger reversal to the upside is in the cards. Otherwise, PayPal may continue to trend lower within the pattern, finding resistance at the upper trendline.
- The stock has resistance above at $77.36 and $82.07 and support below at $73.27 and $68.71.
Photo via Shutterstock.
Edge Rankings
Price Trend
© 2025 Benzinga.com. Benzinga does not provide investment advice. All rights reserved.
Trade confidently with insights and alerts from analyst ratings, free reports and breaking news that affects the stocks you care about.
 See Also: