Zinger Key Points
- Alibaba reversed into a consistent uptrend beginning on Oct. 24.
- Eventually, consolidation will take place because the stock's RSI is nearing overbought territory.
- Get real-time earnings alerts before the market moves and access expert analysis that uncovers hidden opportunities in the post-earnings chaos.
Alibaba Group Holdings, Ltd BABA gapped down more than 3% to open Thursday’s trading session before surging over 10% from the open after printing mixed third-quarter earnings before the bell.
For the quarter, revenue increased 3% year-over-year to RMB 207,176 million ($29.12 billion), which missed average analyst estimates of $29.45 billion. The China-based, e-commerce company reported quarterly earnings of $1.82 per share, which beat average estimates of $1.64 per share.
Alibaba also said its board authorized an increase of $15 billion to the company's existing share repurchase program and extended its duration through the end of March 2025.
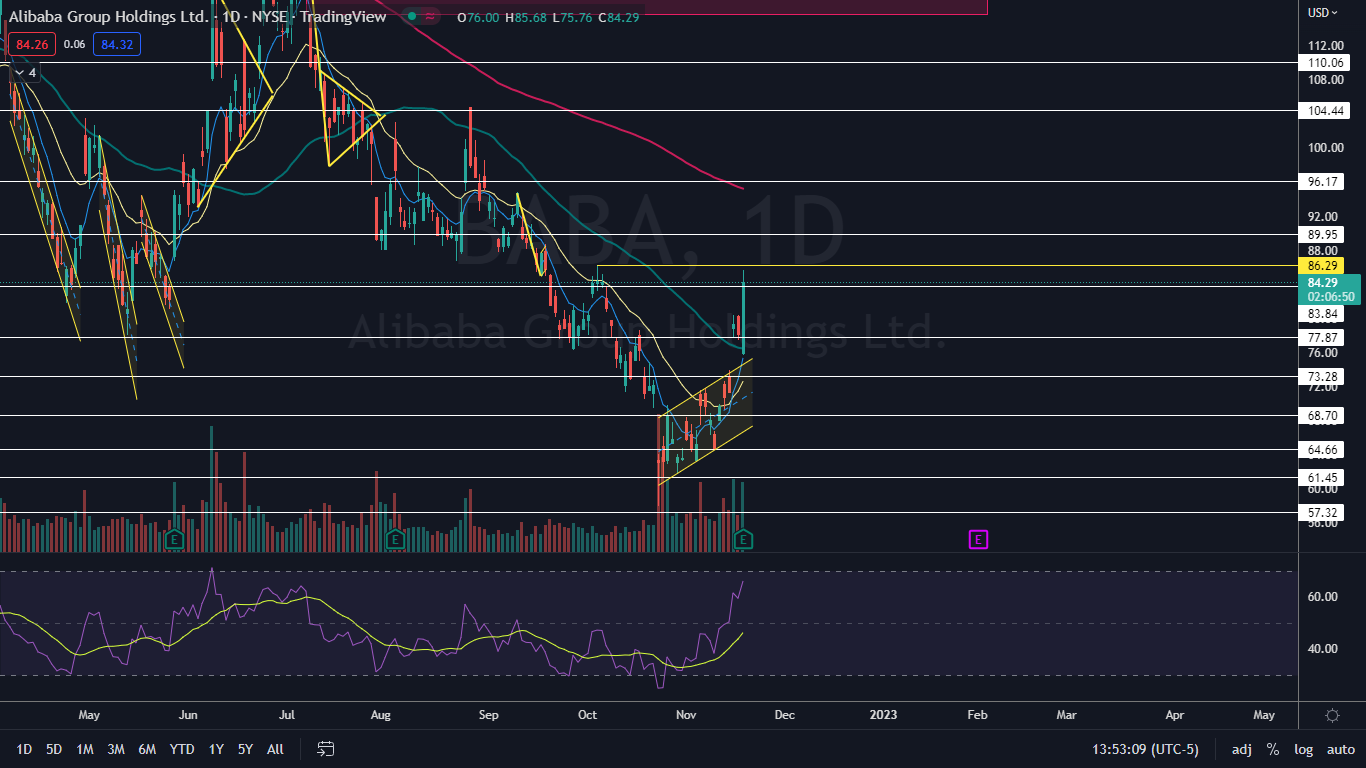
The bullish reaction to Alibaba’s financial results caused the stock to break up bullishly from an inside bar pattern, which was printed over Tuesday and Wednesday, after the stock broke up from a rising channel pattern.
Want direct analysis? Find me in the BZ Pro lounge! Click here for a free trial.
The Alibaba Chart: Alibaba reversed course into an uptrend on Oct. 24 and has made a consistent series of higher highs and higher lows. The most recent higher low was formed on Thursday at $75.76 and the most recent confirmed higher high was printed at the $80.45 mark on Wednesday.
- On Thursday, Alibaba was working to print a bullish engulfing candlestick, which could indicate higher prices will come again on Friday. The second most likely scenario is that the stock prints another inside bar to consolidate Thursday’s surge.
- Eventual consolidation, in the form of an inside bar or slightly retracing prices, is likely because Alibaba’s relative strength index (RSI) is measuring in at about 67%. When a stock’s RSI nears or reaches the 70% level, it becomes overbought, which can be a sell signal for technical traders.
- Over the coming days, bullish traders will want to see Alibaba bust through $86.29 to avoid a bearish double-top pattern forming. Alibaba wicked from that level on Oct. 5 and was wicking from the area again on Thursday, indicating there is heavy resistance there.
- Alibaba has resistance above that area at $89.95 and $96.17 and support below at $83.84 and $77.87.

See Also: Why JD.Com And Pinduoduo Are Exploding Higher Following Alibaba Earnings
Photo: Alibaba
© 2025 Benzinga.com. Benzinga does not provide investment advice. All rights reserved.
Trade confidently with insights and alerts from analyst ratings, free reports and breaking news that affects the stocks you care about.