Zinger Key Points
- Rivian has received an $827 million incentive package ahead of reporting Q1 earnings on Tuesday.
- The stock has been in a stagnant trend, though technicals point to a probable reversal.
- Next: Access Our New, Shockingly Simple 'Alert System'
Wall Street expects Rivian Automotive Inc RIVN to report negative $1.17 in earnings per share (EPS) and $1.163 billion in revenues after market hours on Tuesday.
The stock is down 21.39% over the past year, -57.08%% year-to-date.
An $827M Incentive Package
Recent news indicates Rivian Automotive has announced the receipt of an $827 million incentive package from the Illinois Department of Commerce Economic Opportunity.
The funding is intended to support the expansion of operations at its Normal, Illinois plant and finance job-training programs for employees in preparation for the production launch of the R2, the company’s mid-sized SUV.
Let’s look at what the charts indicate for Rivian stock, and how the stock currently maps against Wall Street estimates.
Rivian’s Upcoming Q1 Earnings
Rivian Automotive stock is currently experiencing a relatively stagnant trend with slight selling pressure.

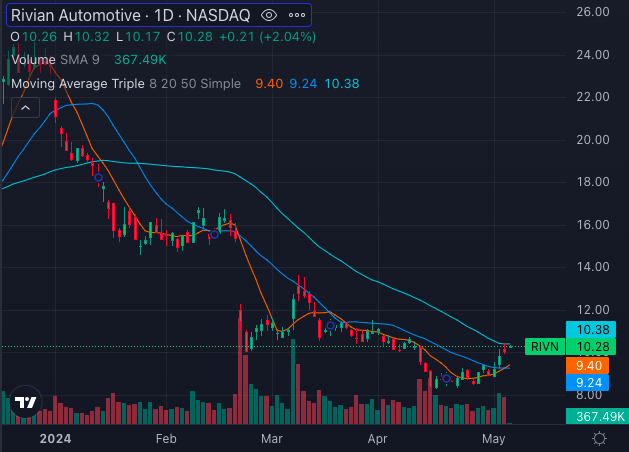
The share price of Rivian is at $10.28, while the eight-day simple moving average (SMA) is at $9.40, signaling bullish sentiments.
Similarly, the 20-day SMA is at $9.24, also indicating some bullishness. However, the 50-day SMA is at $10.38, suggesting a bearish trend, technically.
Moreover, the 200-day SMA, at $17.43, also reinforces the bearish trend.

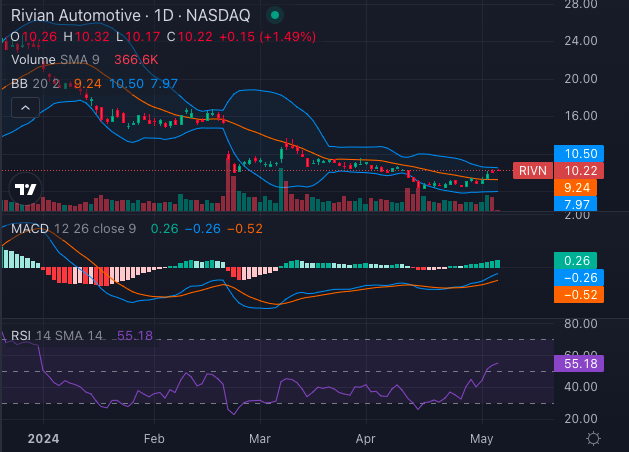
The Moving Average Convergence Divergence (MACD) indicator is -0.26, suggesting bearishness. The Relative Strength Index (RSI) is at 55.18, and currently trending upwards towards the overbought territory beyond 70.
The Bollinger Bands appear to be squeezing in towards the price for some time now. A bollinger band squeeze usually indicates a period of low volatility and potential future price movement.
Traders often interpret this squeeze as a precursor to a significant price breakout or trend reversal. The implication is that as volatility might return to the market, the price is likely to make a strong move in one direction.
The stock has already made its way up from the lower (bearish) Bollinger Band to the upper (bullish) Bollinger Band – giving out a sign of hope.
Given the stagnant Rivian stock has been trapped in, a Bollinger band squeeze might just signal a strong trend coming ahead.
Overall, based on these indicators, Rivian stock appears to be in a bearish phase, with several indicators pointing towards a negative outlook.
Rivian Analysts Consensus Ratings
Ratings & Consensus Estimates: The consensus analyst rating on Rivian stock stands at a Buy currently with a price target of $18.60.
RIVN Price Action: Rivian stock closed the trading day, Friday at $10.07, up 2.44%.
Read Next: Rivian Automotive Receives $827M Incentive Package: What’s Going On With Rivian Stock?
© 2025 Benzinga.com. Benzinga does not provide investment advice. All rights reserved.
Trade confidently with insights and alerts from analyst ratings, free reports and breaking news that affects the stocks you care about.