


The off-price trend has taken the retail wholesale sector by storm in the current economic climate. Consumers are trying to stretch their dollars but don't want to sacrifice quality. This rules out low-quality and low-price outlets like Dollar Tree Inc. DLTR or even Dollar General Co. DG, which sells its items for more than $1, where you get what you pay for in terms of cost and quality. It's the perfect storm environment for leading off-brand retailer The TJX Cos. TJX, who operates popular off-price stores like TJ Maxx, HomeGoods, and Marshalls.
The Rise of Off-Price Retailers and Gamification of Treasure Hunting
Off-price retailers are stores that sell brand-name merchandise at deeply discounted prices, often between 20% to 60% off regular retail prices. Since they buy opportunistically in bulk, their inventory is always changing based on availability rather than seasonality. This creates a ‘treasure hunting' effect that gamifies shopping for bargain hunters, never knowing what great deals they may find on any given day. Off-price retailers fulfill the need to get the most bang for the buck without sacrificing quality.
Some of the most popular off-price retailers include Ross Stores Inc. ROST, Burlington Stores Inc. BURL, and Nordstrom Inc. JWN Nordstrom Rack department stores, which now outnumber its full-price namesake locations.
TJX Companies Portfolio of Brands
TJX is the world's leading off-price apparel and home fashion retailer, with over 4,900 stores located throughout nine countries on three continents. While the most popular brands are TJ Maxx, Marshalls (Marmaxx), and HomeGoods in the United States, their other brands, Sierra, Winners, HomeSense, and TJ Maxx variations (TJX Canada and TJX International Europe and Australia), are popular in other countries. TJX is also investing $360 million for a 35% stake in Brands For Less, a major off-price retailer in Dubai, United Arab Emirates, and Saudi Arabia with over 100 stores.
Marmaxx, which combines TJ Max and Marshalls fashion apparel stores, saw 5% YoY comparable sales in the fiscal second quarter of 2025, on top of the 8% YoY comp sales from the year-ago period. HomeGoods comp sales rose 2% YoY on top of the 4% YoY comp sales last year. TJX Canada saw 2% YoY growth to $1.24 billion. TJX International, comprised of Australia and Europe, saw 4% YoY sales to $1.68 billion in the second quarter.
TJX Keeps the Momentum Flowing Into the Holiday Season
In its fiscal second-quarter 2025 earnings report, TJX beat consensus analyst estimates by 4 cents, reporting 92 cents. Revenues rose 5.6% YoY to $13.47 billion, beating $13.31 billion consensus estimates. Same-store sales (SSS) rose 4% YoY, nicely beating its guidance range of 2% to 3% YoY, completely driven by increased customer transactions. Pre-tax margin rose 50 bps to 10.9%, up from 10.4% last year. Total inventories were $6.5 billion, down from $6.4 billion in the year-ago period. TJX bought back $559 million in stock and ended the quarter with $5.3 billion in cash. The company opened its 5,000th store in the quarter.
TJX Issues Forecasts
For the third quarter of 2024, TJX sees EPS of $1.06 to $1.08, which is why of the $1.10 consensus estimates. Same-store comps are expected to be between 2% and 3%.
Full-year fiscal 2025 EPS is expected to be between $4.09 and $4.13 versus $4.03 and $4.13 consensus estimates. Full-year comps are expected to be 3% from 2% to 3%.
TJX CEO Ernie Herrman commented, "The third quarter is off to a strong start, and we have numerous plans underway to drive traffic and sales. Availability of quality branded merchandise is excellent, and we are confident we will have an exciting assortment of fresh goods across all of our stores and online throughout the fall and holiday selling seasons."
TJX Stock Is in a Symmetrical Triangle Pattern
A symmetrical triangle pattern precedes a breakout or breakdown. It's comprised of a converging descending upper trendline and ascending lower trendline connected at the apex point. The breakout or breakdown occurs ahead of reaching the apex point.
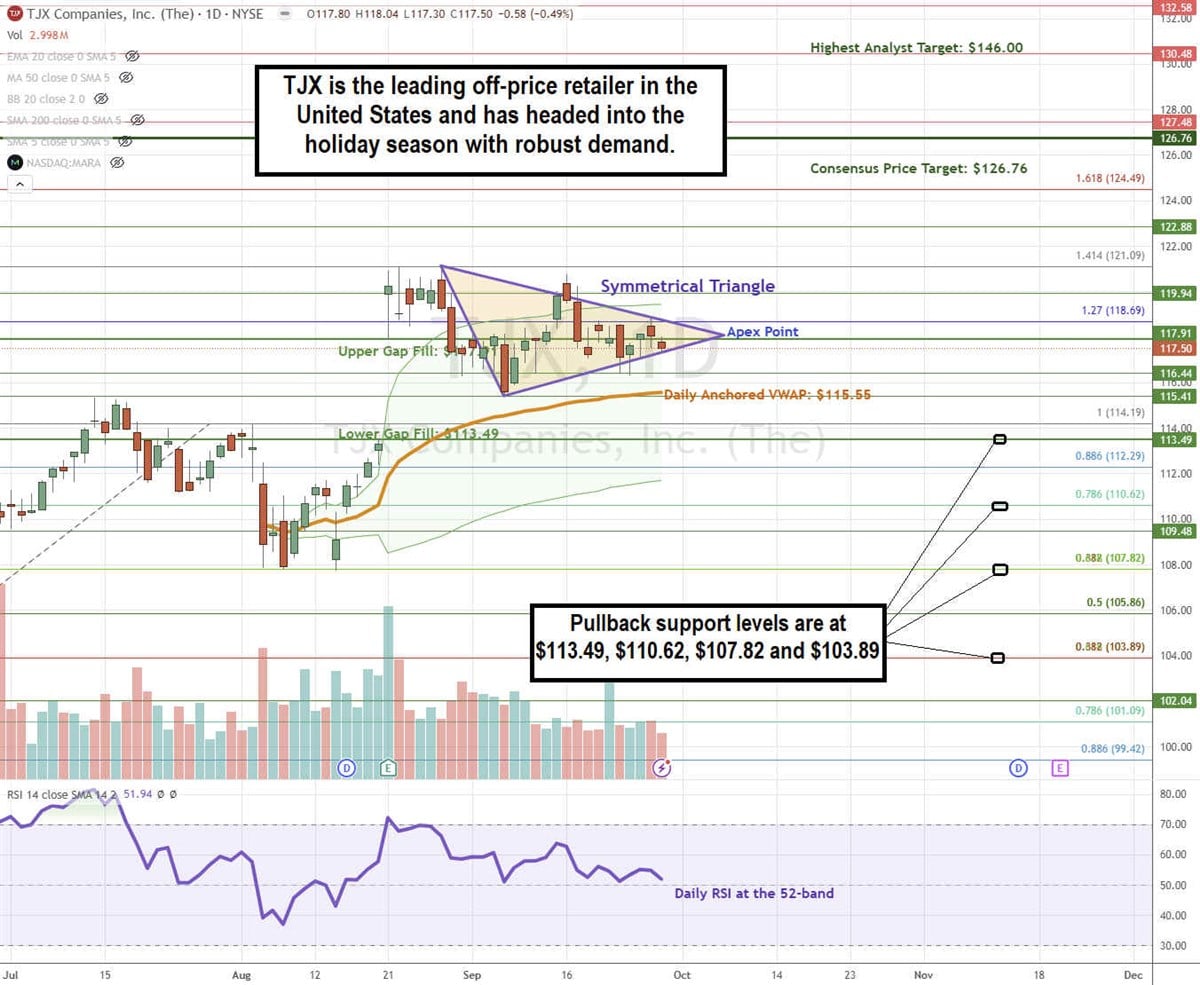
TJX gapped to $117.91 following its fiscal Q2 2025 earnings release. After peaking at $121.09, TJX formed a series of lower highs and higher lows, making up the two divergence trendlines meeting at the apex point near the upper gap-fill level of $117.91. The daily anchored VWAP is at $115.55. The daily relative strength index (RSI) has been trending lower to the 52-band. Fibonacci (Fib) pullback support levels are at $113.49, $110.62, $107.82, and $103.89.
TJX's average consensus price target is $126.76, and its highest analyst price target is $148. Analysts have given it 13 Buy ratings and 3 Hold ratings.
Actionable Options Strategies: Bullish investors can buy on pullbacks using cash-secured puts to take advantage of the elevated premiums at the fib pullback support levels to buy the dip and write covered calls to execute a wheel strategy for income in addition to the 1.28% annual dividend yield.
The article "TJX Stock: A Buying Opportunity Before the Holiday Rush" first appeared on MarketBeat.
Edge Rankings
Price Trend
© 2025 Benzinga.com. Benzinga does not provide investment advice. All rights reserved.
Trade confidently with insights and alerts from analyst ratings, free reports and breaking news that affects the stocks you care about.

