Zinger Key Points
- American Express stock is bullish ahead of its third quarter earnings report on Oct. 18.
- Analysts see a 6.54% downside, with an average price target of $266 despite strong performance.
- Get two weeks of free access to pro-level trading tools, including news alerts, scanners, and real-time market insights.
American Express Co AXP will be reporting its third-quarter earnings on Oct. 18. Wall Street expects $3.80 in earnings per share and $16.67 billion in revenues as the company reports before market hours.
The stock is up 84.29% over the past year, 51.1% year-to-date.
Let’s look at what the charts indicate for the New York-based company and how its stock currently maps against Wall Street estimates.
American Express Stock Chart Is Bullish
American Express stock is exhibiting strong bullish momentum based on several technical indicators.

Chart created using Benzinga Pro
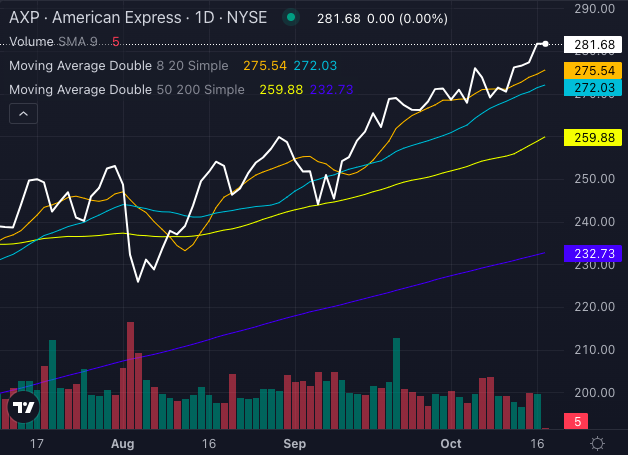
The stock is currently trading at $281.68, which places it above key moving averages—its five-day, 20-day and 50-day exponential moving averages—indicating significant buying pressure.
American Express’ stock price is above its eight-day SMA of $275.54. The 20-day SMA of $272.03 further confirms a bullish outlook. This suggests continued upward movement. The stock's 50-day SMA at $259.88 and its 200-day SMA at $232.73 are also well below the current price, reinforcing this positive trend.

Chart created using Benzinga Pro
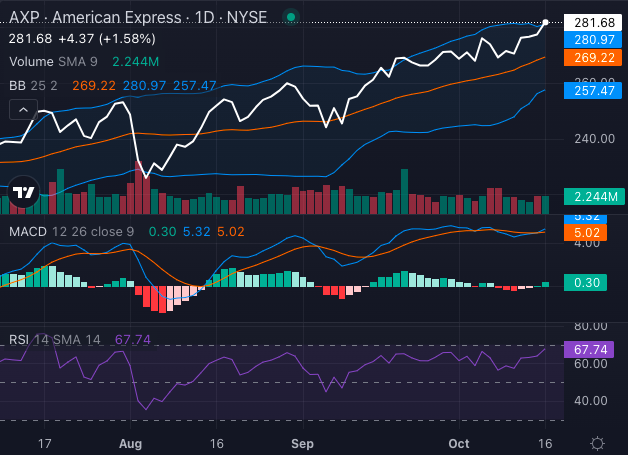
Additionally, the MACD indicator is at 5.32, which signals further bullish potential for American Express stock. However, caution is warranted as the RSI stands at 67.74, and rising to approach the overbought territory. This could suggest a short-term pullback.
However, the Bollinger Bands also indicate that the stock remains in a bullish phase with the stock trading in then upper bullish band.
Investors should monitor these technical signals closely as the stock approaches a potential breakout.
Read Also: Here’s How Much $1000 Invested In This Payments Company 15 Years Ago Would Be Worth Today
…But Analysts See 7% Downside
Ratings & Consensus Estimates: The consensus analyst rating on American Express stock stands at a Neutral currently with a price target of $228.60. The latest analyst ratings for American Express stock were issued by Morgan Stanley, Monness, Crespi, Hardt, and Barclays in October. These analysts have set an average price target of $266, indicating an implied downside of 6.54% for the stock.
AXP Price Action: American Express stock was trading at $284.62 at the time of publication.
Read Next:
Image: Shutterstock
© 2025 Benzinga.com. Benzinga does not provide investment advice. All rights reserved.
Trade confidently with insights and alerts from analyst ratings, free reports and breaking news that affects the stocks you care about.