

Zinger Key Points
- Bank of America's technicals flash bullish, while Morgan Stanley faces mixed signals before earnings day.
- Investors eye $25.24 billion Bank of America revenue and Mongan Stanley's wealth management for clues to market leadership.
- How to Spot the Market Bottom: Matt Maley has navigated every major market turn in the last 35 years, and on Wednesday, March 26, at 6 PM ET, he’s revealing how to recognize when the worst is over, the trades to make before the next bull market takes off, and the stocks and sectors that will lead the recovery.
As Bank of America Corp BAC and Morgan Stanley MS prepare to report fourth-quarter earnings Thursday morning, Wall Street is watching. With both stocks riding high after a strong year, it's a showdown between Main Street lending and Wall Street dealmaking.
The Bullish Case For Bank of America Stock
Bank of America’s stock has surged 46.72% over the past year and continues to climb, buoyed by positive technical signals.
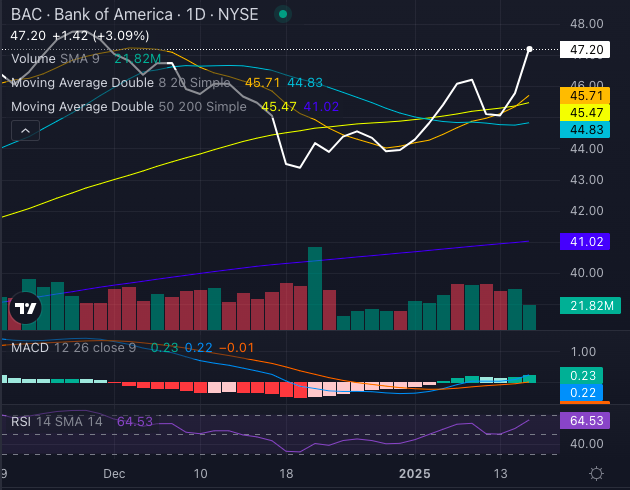
Chart created using Benzinga Pro
Trading at $47.20, Bank of America stock sits comfortably above its key moving averages, flashing bullish momentum.
- The eight-day SMA (simple moving average) at $45.71 and 50-day SMA at $45.47 both signal bullish momentum.
- The MACD (moving average convergence/divergence) indicator at 0.22 adds to the optimism for future gains.
- BAC stock’s RSI (relative strength index) of 64.53 suggests the stock has room to run before entering overbought territory.
Investors expect $25.24 billion in revenue and EPS of 77 cents, with strong consumer lending as a potential bright spot.
Read Also: Wall Street’s Bonus Frenzy: Top Investment Bankers Eye Double-Digit Pay Boosts As Markets Flourish
Morgan Stanley Stock Faces Mixed Signals But Keeps Long-Term Strength
Despite a 51.70% gain over the past year, Morgan Stanley shows signs of cooling off.
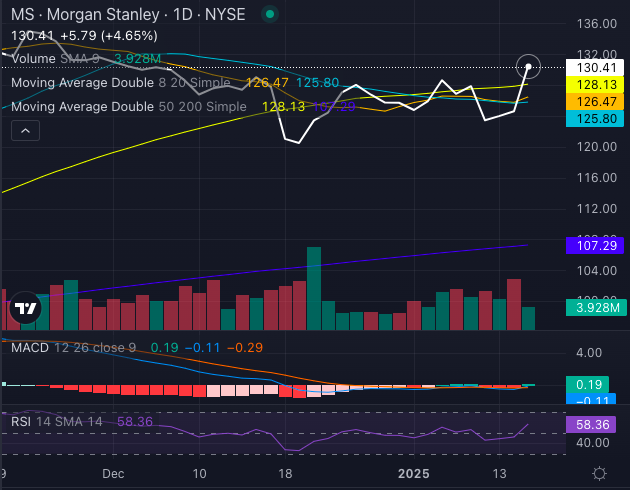
Chart created using Benzinga Pro
Morgan Stanley stock, at $130.41, sits above its eight-day ($126.47), 20-day ($125.80) and 50-day ($128.13) SMAs, signaling bullishness.
- The MACD, however, is a negative 0.11 and the RSI at 58.36 point to sluggish momentum.
- Yet, trading above its 200-day SMA ($107.29) hints at sustained longer-term strength.
Analysts project $15.03 billion in revenue and $1.70 EPS, with Morgan Stanley's wealth management and investment banking segments under scrutiny.
Market Watchers Split On Winners
Technical indicators favor Bank of America's near-term bullish case, while Morgan Stanley's diversified revenue streams offer longer-term resilience.
Both are poised for a financial tug-of-war as investors assess growth prospects amid rising rates and market volatility.
With the Bank of America stock flashing bullish signals across the board and Morgan Stanley stock facing a MACD hiccup, earnings day could reveal who truly holds the upper hand: steady lending or savvy dealmaking. Stay tuned.
Read Next:
Photos: Shutterstock
Edge Rankings
Price Trend
© 2025 Benzinga.com. Benzinga does not provide investment advice. All rights reserved.
Trade confidently with insights and alerts from analyst ratings, free reports and breaking news that affects the stocks you care about.

