


Zinger Key Points
- PG stock faces bearish pressure with key SMAs above current price, indicating potential further downside.
- Analyst consensus sees 4% upside, with recent price targets implying modest recovery for PG stock.
- Today's manic market swings are creating the perfect setup for Matt’s next volatility trade. Get his next trade alert for free, right here.
Procter & Gamble Co PG will be reporting its second-quarter earnings on Wednesday. Wall Street expects $1.86 in EPS and $21.54 billion in revenues as the company reports before market hours.
The stock is up 9.29% over the past year, down 2.64% YTD.
Let’s look at what the charts indicate for Procter & Gamble stock and how the stock currently maps against Wall Street estimates.
Read Also: Dogs Of The Dow: Top 10 High-Yield Stocks Offering Dividends Up To 6.8% In 2025
PG Stock Chart Bearish Ahead Of Q2 Earnings
PG stock is showing a strongly bearish trend, with its price of $161.59 trading below its five, 20 and 50-day exponential moving averages.
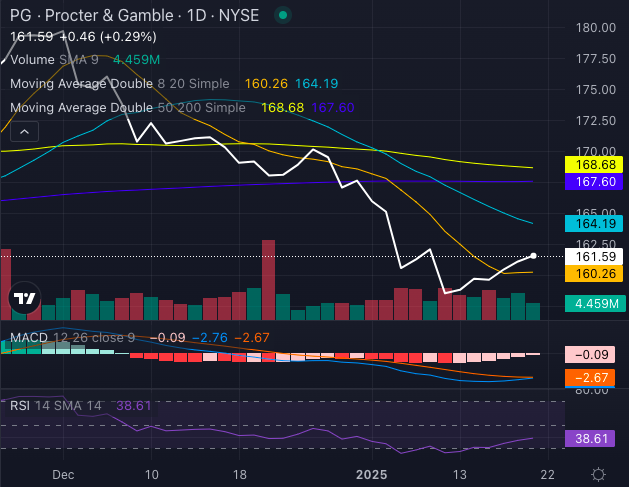
Chart created using Benzinga Pro
While slight buying pressure is evident as the eight-day SMA (simple moving average) at $160.26 signals a bullish move, the broader setup remains bearish, with the 20-day SMA at $164.19, 50-day SMA at $168.68, and 200-day SMA at $167.60 all above the current price.
The MACD (moving average convergence/divergence) indicator at a negative 2.76 reinforces downside momentum, while the RSI (relative strength index) at 38.61 suggests the stock is nearing oversold territory but not there yet.
Procter & Gamble Analysts See 4% Upside
Ratings & Consensus Estimates: The consensus analyst rating on Procter & Gamble stock stands at a Buy currently with a price target of $175.42. The latest analyst ratings from Barclays, Stifel, and UBS give PG stock an average price target of $168.33, implying a 4.01% upside.
PG Price Action: Procter & Gamble stock was trading at $161.63 at the time of publication.
Read Next:
Edge Rankings
Price Trend
© 2025 Benzinga.com. Benzinga does not provide investment advice. All rights reserved.
Trade confidently with insights and alerts from analyst ratings, free reports and breaking news that affects the stocks you care about.

