Market Fear Gauge Approaches 2020 Levels
As ZeroHedge reported on Monday, the Fear & Greed gauge has approached early 2020 levels.
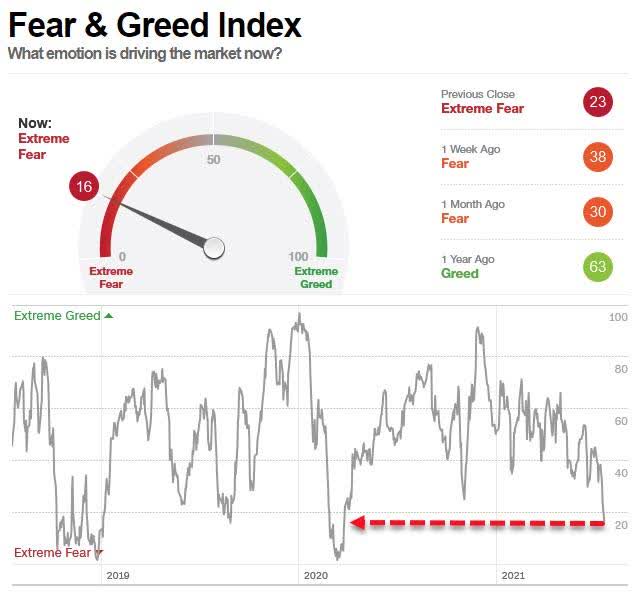
Screen capture via ZeroHedge.
The Fear & Greed Index incorporates seven factors to measure market sentiment: junk bond demand, market momentum, market volatility, safe haven demand, stock price strength, put and call options, and stock price breadth. As of Monday, each was signaling either "fear" or "extreme fear". Let's look at a way you can put money to work now while trying to maximize your returns and at the same time strictly limit your risk.
Building A Hedged Portfolio
Our approach to investing in a state of fear is to buy likely winners and hedge away the fear. Here's an example, followed by an explanation. Let's say that you have $500,000 in cash you want to put to work now, but you aren't willing to risk a drawdown of more than 20% over the next six months. If you indicated that in our hedged portfolio construction tool on Monday,
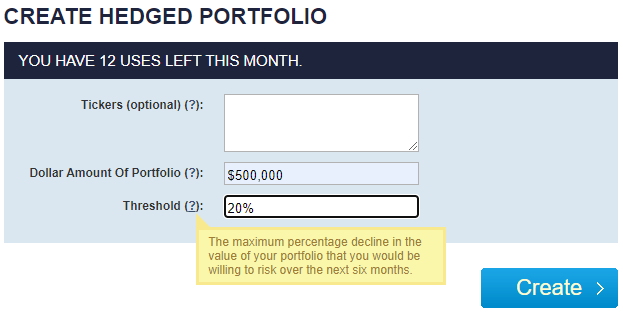
This and subsequent screen captures are via Portfolio Armor.
This is the portfolio it would have presented to you.
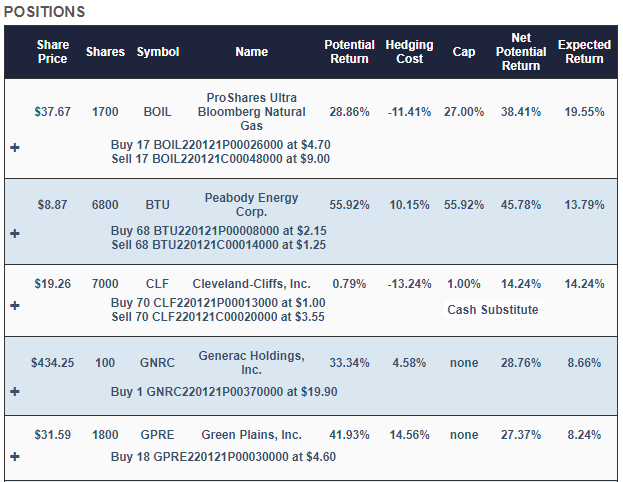
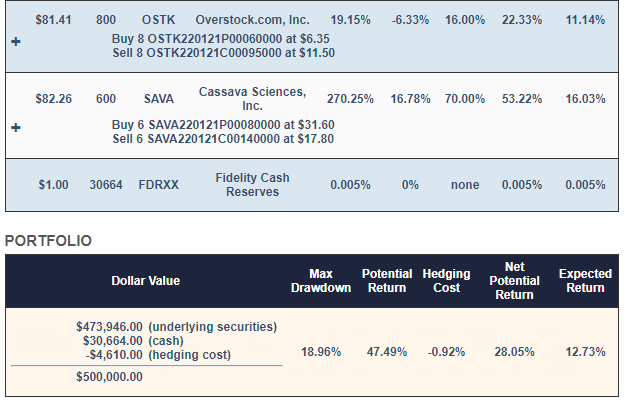
With this, your maximum drawdown over the next six months - that is, if every underlying security went to zero - would be a decline of 18.96%. Your best case scenario would be a gain of about 28%, and your expected return (a more likely scenario) would be a gain of a little under 13% in six months.
Why These Stocks?
Each trading day, our system analyzes total returns and options market sentiment to estimate potential returns for thousands of stocks and ETFs. The ProShares Ultra Bloomberg Natural Gas ETF BOIL, Peabody Energy Corporation BTU, Generac Holdings GNRC, Green Plains, Inc. GPRE, Overstock.com, Inc. OSTK, and Cassava Sciences, Inc. SAVA were selected because they were among our top names: the ones that had the highest potential returns, net of hedging costs. Our system started with roughly equal dollar amounts of each, and then rounded them down to round lots, to reduce hedging costs. It swept up most of the leftover cash from the rounding-down process into a tightly hedged Cleveland-Cliffs, Inc. CLF position, to further reduce hedging cost.
Why No Silver Or Gold?
On Monday, silver and gold ETFs didn't appear among our top names. But you could have added tickers for them in the optional ticker field if you wanted to.
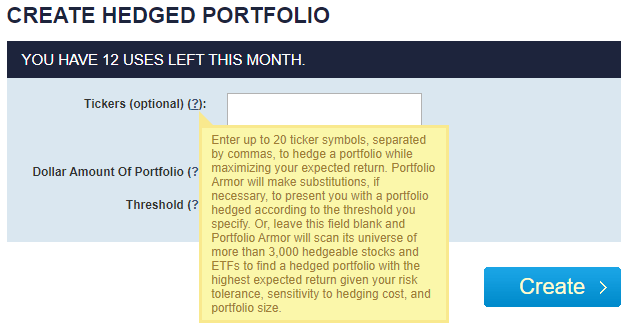
For the portfolio above though, we let our system pick all of the securities itself.
Why These Hedges?
On our website, if you click the plus signs in the portfolio above, the positions expand to give you a better look at the hedges. For example, this is what the GNRC position looks like expanded.

GNRC is hedged with an optimal, or least expensive, put option. Most of the other positions are hedged with optimal collars. Our system estimates returns both ways to determine which type of hedge is best.
Using Volatility To Your Advantage
Thanks in part to higher volatility, three of the collared positions in the hedged portfolio have negative hedging cost. As a result, the portfolio as a whole has a negative hedging cost, meaning you would have collected a net credit of $4,610 in aggregate when opening these positions, assuming, to be conservative, that you bought the puts at the ask and sold the calls at the bid (in practice, you can often buy and sell options at some price between the bid and ask).

If we're right about most of these names, you'll make some money with this portfolio, and if we're wrong, your downside will be strictly limited. We'll check back in a few months and see how this one is doing.
Edge Rankings
Price Trend
© 2025 Benzinga.com. Benzinga does not provide investment advice. All rights reserved.
Trade confidently with insights and alerts from analyst ratings, free reports and breaking news that affects the stocks you care about.