Zinger Key Points
- Virgin Galactic has a 52-week high of $57.51 and a 52-week low of $6.70.
- For the first quarter, analysts expect Virgin Galactic to report a loss of 31 cents per share on revenue of $120,000.
Virgin Galactic Holdings, Inc SPCE is set to print its first-quarter financial results after the market close. The stock was trading over 10% lower heading into the event and remains down over 85% from the Feb. 4, 2021 all-time high of $62.80.
After Richard Branson's space tourism company printed its first-quarter results on Feb. 22, the stock soared up about 30% over the following five trading days but has spent the months since trading mostly sideways between $6.70 and $11.25.
For the fourth quarter, Virgin Galactic reported stronger-than-expected earnings, with a loss of 31 cents per share, which beat the analyst estimate of a 34-cent loss. The company reported revenue of $414,000 billion, which beat analysts estimate of $330,000.
For the first quarter, analysts expect Virgin Galactic to report a loss of 31 cents per share on revenue of $120,000.
The analyst estimate may seem low, considering that on Feb. 16 Virgin Galactic opened ticket sales for space flight reservations, set to begin at the end of this year. Traders and investors will be watching to see how many bookings Virgin Galactic was able to make, with reservations costing $450,000 and requiring a $150,000 deposit upfront.
If even one person reserved a 90-minute journey to space, Virgin Galactic will beat on revenue estimates by over 20%.
From a technical analysis standpoint, Virgin Galactic stock appears headed to be headed lower still. Of course, holding stocks or options over an earnings print is akin to gambling because stocks can react bullishly to an earnings miss and bearishly to an earnings beat.
Options traders particularly, those who are holding close dated calls or puts, take on extra risk because the intuitions writing the options increase premiums to account for implied volatility. The implied move for options of Virgin Galactic expiring this week is 11.86%.
Want direct analysis? Find me in the BZ Pro lounge! Click here for a free trial.
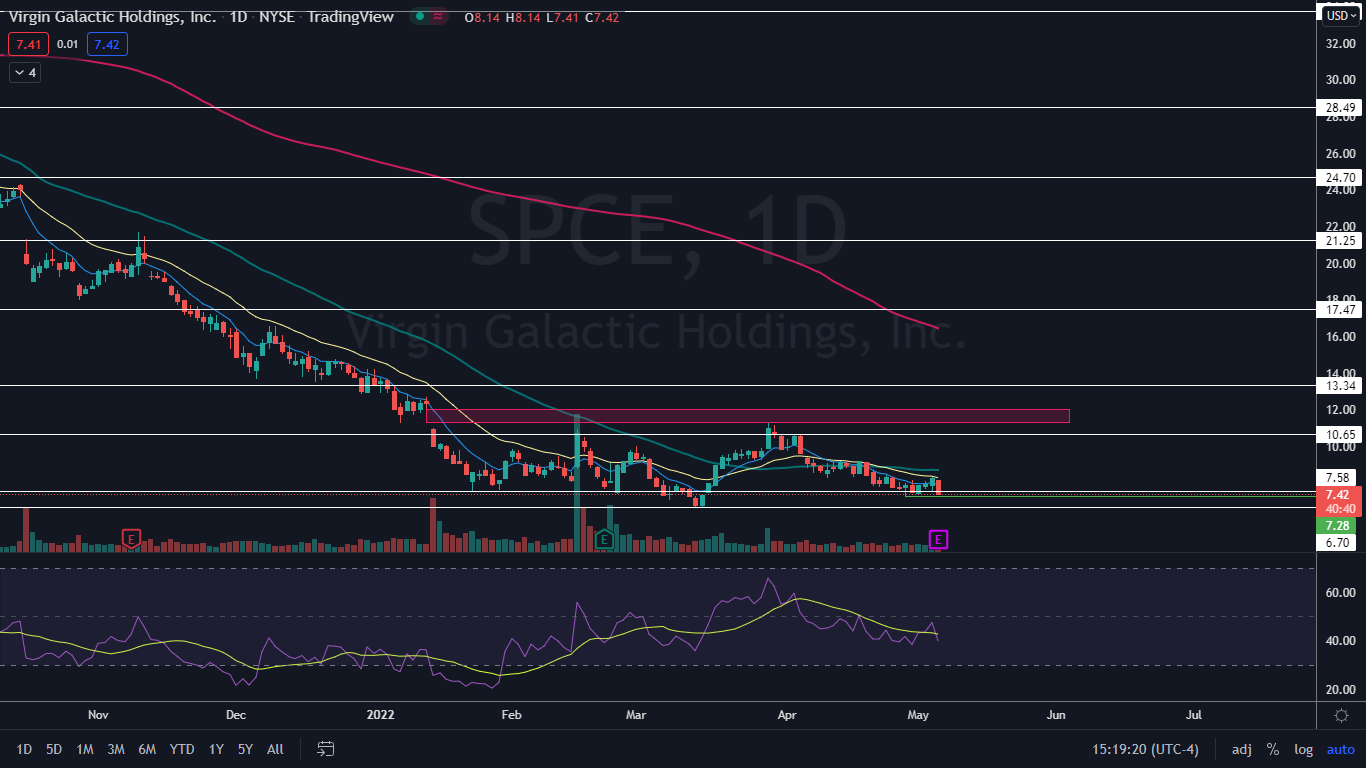
The Virgin Galactic Chart: Virgin Galactic reversed course into a small uptrend on April 28, when the stock fell to the $7.28 level. Virgin Galactic’s most recent higher high in the trend was printed at the $8.32 level on Wednesday and the most recent confirmed high low was formed on May 2 and $7.38.
- On Thursday, Virgin Galactic was looking to print a bearish Marubozu candlestick, which indicates lower prices may come on Friday. If that happens, the stock will negate its uptrend by forming a lower low.
- Virgin Galactic has a gap above on its chart between $11.25 and $12.06. Gaps on charts fill about 90% of the time, which makes it likely the stock will trade up to fill the empty range in the future, although it could be some time before that happens unless Virgin Galactic has a big bullish reaction to its earnings print.
- Virgin Galactic has resistance above at $7.68 and $10.65 and support below at $7.28 and the all-time low of $6.70.

© 2025 Benzinga.com. Benzinga does not provide investment advice. All rights reserved.
Trade confidently with insights and alerts from analyst ratings, free reports and breaking news that affects the stocks you care about.