Zinger Key Points
- Death Cross signals warn of more pain ahead for long-term Treasury ETFs such as TLT, VGLT and UTHY.
- Rising yields and declining prices are challenging bond investors.
- Feel unsure about the market’s next move? Copy trade alerts from Matt Maley—a Wall Street veteran who consistently finds profits in volatile markets. Claim your 7-day free trial now.
It’s been a wild ride for long-term Treasury ETFs lately, and it's looking like they might have hit a rough patch. Following months of declining interest rates, yields on U.S. Treasurys reversed course in October, and the charts are now flashing a warning: the dreaded Death Cross is looming.
For those who aren’t familiar, the Death Cross occurs when the short-term moving average (such as the 50-day) crosses below the long-term moving average (like the 200-day).
And that's exactly what's been happening for a trio of heavy hitters in the bond market: iShares 20+ Year Treasury Bond ETF TLT, Vanguard Long-Term Treasury ETF VGLT, and US Treasury 30 Year Bond ETF UTHY.
The recent surge in long-end yields, after months of decline, has turned this segment of the market into a hotbed of concern. The 10-year U.S. Treasury note yield, which fell to a low of 3.63% in September, jumped more than 0.80% as the Federal Reserve cut the federal funds target rate in September and November.
Read Also: Viking Therapeutics Stock On Brink Of Death Cross As Weight Loss Hype Loses Momentum
The result? A sharp inverse reaction in Treasury bond prices, and unfortunately, for these ETFs, that's a price decline.
Let's break it down:
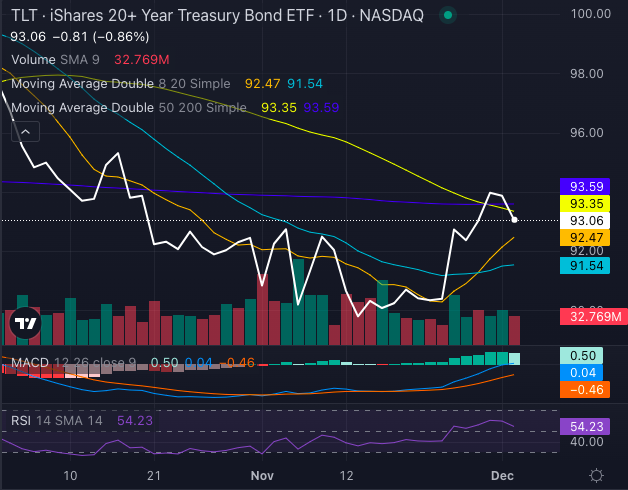
- iShares 20+ Year Treasury Bond ETF: Once a star of the bond world, this ETF now has its 50-day simple moving average below its 200-day. And while it’s seeing a bit of buying pressure, the bearish signals on the chart indicate a downward trend that could be setting up. With a stock price at $93.06 and RSI at 54.23, things aren’t looking rosy for this long-duration bond fund.

Chart created using Benzinga Pro
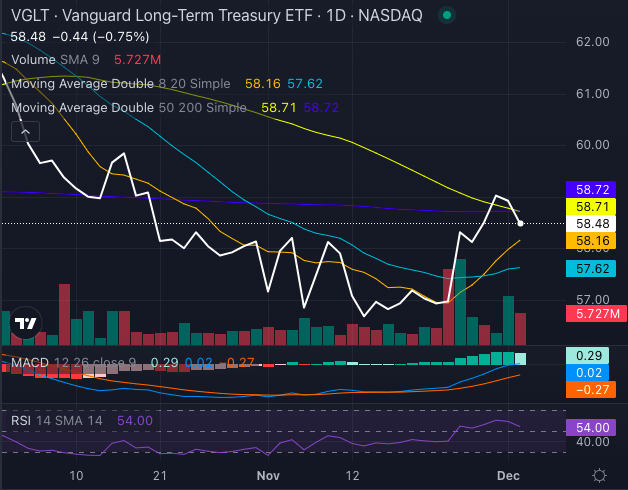
- Vanguard Long-Term Treasury ETF: This ETF is in the same boat, with its 50-day moving average below the 200-day. It has a similar chart pattern to iShares 20+ Year Treasury Bond ETF and shows potential for future bearish movement as the market contemplates further interest rate hikes. At $58.48 and an RSI of 54, it's hard to argue against the bearish signals forming.

Chart created using Benzinga Pro
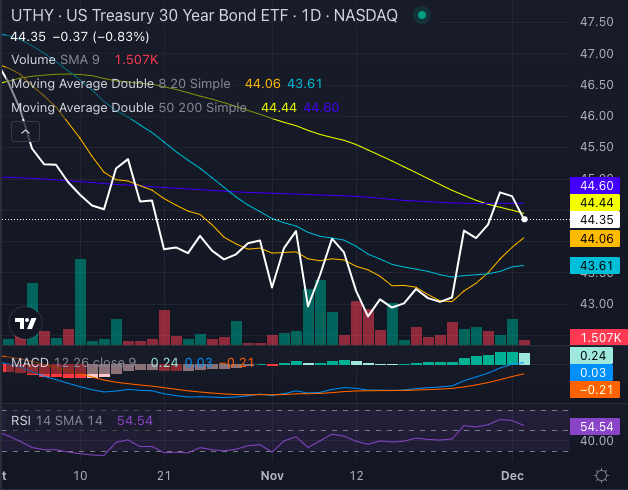
- U.S. Treasury 30 Year Bond ETF: Last but not least, this ETF is also struggling to hold onto its gains. Its price at $44.35 isn't enough to offset the pressure from the moving averages. Although the short-term outlook has some bullish signs, the 50-day SMA crossing below the 200-day indicates a tough road ahead.

Chart created using Benzinga Pro
With a surge in long-term Treasury yields, it's clear that the long bond party might be winding down. Investors betting on these ETFs are facing an uphill battle, and a higher interest rate environment seems to be taking its toll.
For those holding these three ETFs, it might be time to re-evaluate your exposure to these long-duration bonds before the Death Cross turns into a market-wide plunge.
Read Next:
Photo: Shutterstock
Edge Rankings
Price Trend
© 2025 Benzinga.com. Benzinga does not provide investment advice. All rights reserved.
Trade confidently with insights and alerts from analyst ratings, free reports and breaking news that affects the stocks you care about.