

Link LINK/USD and Polkadot DOT/USD are down 13% and 30%, respectively, from their all-time highs amid Bitcoin’s BTC/USD retreat into consolidation.
With the raging popularity of cryptocurrencies lately, Link and Polkadot’s downturn may just be a much-needed cool-off period as both charts are still flashing bullish signals.
The Polkadot Chart: This past Saturday, Polkadot made a run towards its all-time high of $50.70 made back on its Kraken exchange debut on Aug. 18, 2020. The cryptocurrency was unable to reach it and has since lost two support levels at $42.18 and $37.55 while holding and bouncing off support near the $32 mark. The lower wicks on the daily chart indicate any dips in Polkadot are being bought by bulls, however.
Although the downturn caused the eight-day exponential moving average (EMA) to cross below the 21-day EMA, which is bearish, Polkadot printed a bullish hammer candlestick on Tuesday indicating a reversal in the downtrend. A push back up above $37.55 would help Polkadot to regain the eight-day EMA and trade back above it.
Bulls want to see a continuation of the hammer reversal pattern and for Polkadot to pop back up over its overhead resistance. If Polkadot is able to regain the $36 level, it has room to move back up towards $42.
Bears want to see the bullish hammer pattern negated and for Polkadot to set up a bear flag pattern under $36. If the bear flag becomes the more recognized pattern, the stock could retest support at $31.87. A loss of that support level could see Polkadot revisit $27.78

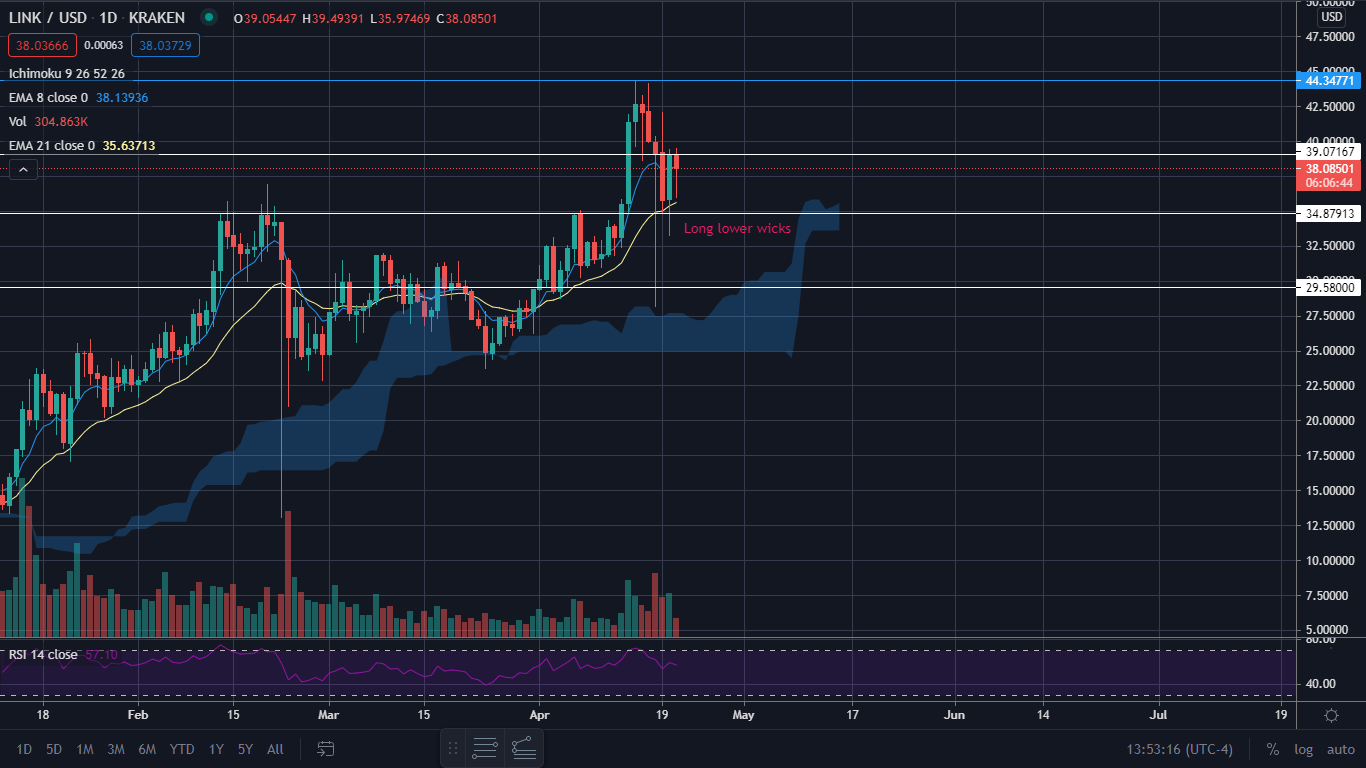
The Link Chart: Although Link is trading near its all-time high of $44.34, the past three trading days have created a new resistance level at $39.07 as the cryptocurrency has failed to trade above it. Like Polkadot, the daily candles have long lower wicks indicating bulls are buying any dip.
Link is trading above both the eight-day and 21-day EMAs with the eight-day EMA trending above the 21-day EMA which is bullish.
See Also: A Cryptocurrency, A Big Board Name, And A Penny Stock Look Bullish Going Into The Week
Bulls want to see Link jump up over the $39 level to make a run back for all-time highs. If it can clear $44.34 it’s blue skies ahead. The more times Link tries to break its overhead resistance the weaker the resistance becomes.
Bears want to see Link continue to reject $39 and retrace to $34.87. If Link can’t hold that level of support, it could fall further to $29.58.
© 2025 Benzinga.com. Benzinga does not provide investment advice. All rights reserved.
Trade confidently with insights and alerts from analyst ratings, free reports and breaking news that affects the stocks you care about.

