Courtesy of Chris Ciovacco, Ciovacco Capital
As we noted on November 1, a rally back toward 1,250 is well within bear market bounds. How we rally (volume, conviction, etc.) will tell us quite a bit about the odds of a more lasting upside move in stocks. We also outlined in a recent video reasons why the improvement in market breadth does not necessarily lean toward bullish outcomes. We are open to higher highs in stocks and the onset of a new bull market, we just do not have the evidence in hand to support those outcomes at this time.
We reviewed leading ETFs from several angles last night, including volume. The interest in Treasuries (TLT) and TIPS (TIP) was high in Tuesday's session, with Treasuries getting a slight nod over TIPS. We will be watching the relative performance of TLT and TIP after today's Fed announcement.
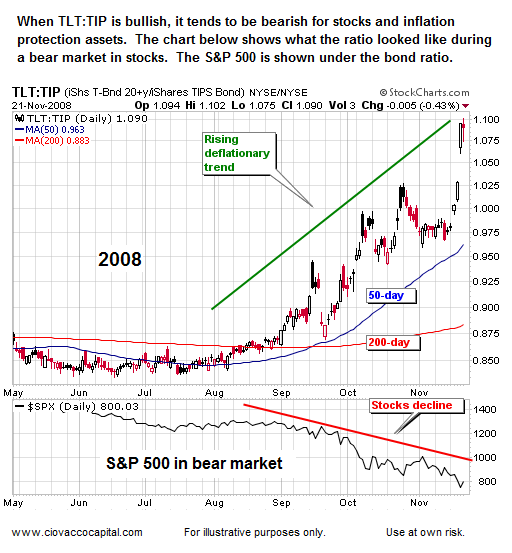
When the ratio of Treasuries to TIPS is rising it points to (a) little concern about inflation, and (b) increasing concerns about deflation. The chart below shows what the TLT:TIP ratio looks like during a bull market in deflation fears and a bear market in stocks.

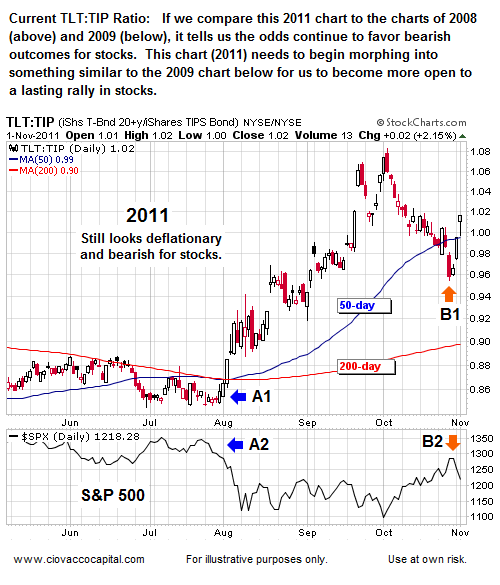
The current TLT:TIP ratio is shown below. Notice the behavior of stocks as the bond ratio began rising in August (see points A1 and A2 below). A similar move may be occurring now (see B1 and B2). There are numerous similarities to the current TLT:TIP ratio and the ratio shown above during the 2008 phase of the last bear market: (1) the slope of the 200-day is positive, (2) the 50-day is above the 200-day, and (3) price is above the 200-day. Items 1 through 3 are characteristics of a bull market, which means we currently have a bull market in deflation fears, which is bearish for risk assets. Could the Fed change this dynamic by cranking up the printing presses? It's possible.

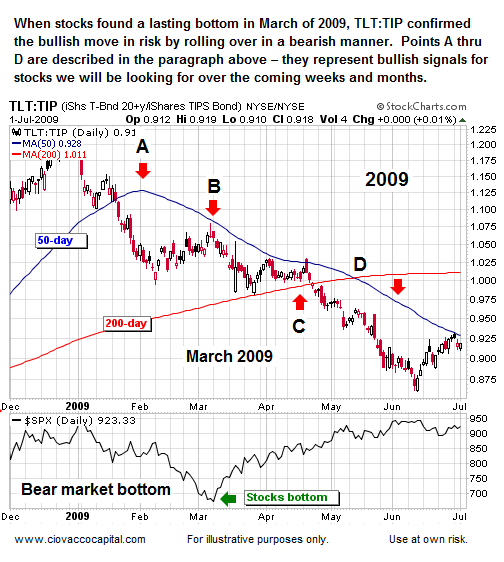
What does the TLT:TIP ratio look like near a lasting bear market bottom? (1) The slope of the 50-day needs to roll over (point A), (2) price needs to fail on a retest of the 50-day (point B), (3) price needs to break below the 200-day (point C), and (4) a death-cross (50 drops below 200) needs to occur (point D).

Referencing the chart above, in the present day do we have the bullish signals for stocks similar to:
- Point A? No
- Point B? No
- Point C? No
- Point D? No
The answers above tell us to continue to give the stock bears the benefit of the doubt. Until conditions change, the longer-term outlook continues to favor conservative and bear market assets, such as bonds (TLT, IEF), the dollar (UUP), and shorts (SH). Gold (GLD) is in somewhat of a neutral position and is worth watching.
On August 12, we noted a bear market rally could carry the S&P 500 all the way back to 1,260. We also noted “other bull market tests take the form of the now downward-sloping 200-day moving average and the downward-sloping trendline”. The recent rally stalled and is now below (a) 1,260, (b) bearish trendlines, and (c) the S&P 500's 200-day moving average (1,274). While the recent rally was impressive and may yet morph into a bullish set-up, nothing has occurred yet that is outside of historical norms for a bear market rally. Bear market rallies are historically strong.
The market isn't expecting any earth-shattering announcements from the Fed today, but laying groundwork for more QE (money printing) is a possibility. The Fed is ultra sensitive to the threat of deflation. The Treasury and TIPS markets are sending deflationary signals similar to the summer of 2010, when the Fed hinted at QE2. From this morning's Wall Street Journal:
The Fed does appear to be moving toward making its policy targets even more explicit. Part of the reason for doing so could be to justify additional easing maneuvers aimed at lowering the nation's 9.1% unemployment rate, even at the risk of somewhat higher inflation.
Remarkably, given its usual sensitivities to any Fed rumblings, the bond market seems to have shrugged this off. One way of gauging investors' medium-term inflation outlook is to compare the yield on five-year Treasury notes with five-year Treasury inflation-protected securities. This serves as a proxy for what inflation is expected to average annually over the next five years. And far from creeping higher on such Fed talk lately, inflation expectations have actually declined.
After reaching nearly 3% earlier this year, the market's five-year implied inflation rate on Monday dropped below 2.2%. That still is above the sub-2% level hit in August 2010 before the Fed announced its $600 billion bond-buying program, but not by much. The market already was flirting with sub-2% levels early last month.
© 2025 Benzinga.com. Benzinga does not provide investment advice. All rights reserved.
Trade confidently with insights and alerts from analyst ratings, free reports and breaking news that affects the stocks you care about.
