Bitcoin Cash BCH/USD is trading higher Friday alongside most of the cryptocurrency market.
The last time Bitcoin Cash saw a resistance break with consolidation above the resistance level, it went on to reach highs of over $1,600. There is a possibility that another resistance break allows the crypto to do the same thing once again.
Bitcoin Cash was up 8.48% at $721.07 at last check Friday afternoon.
Bitcoin Cash Daily Chart Analysis
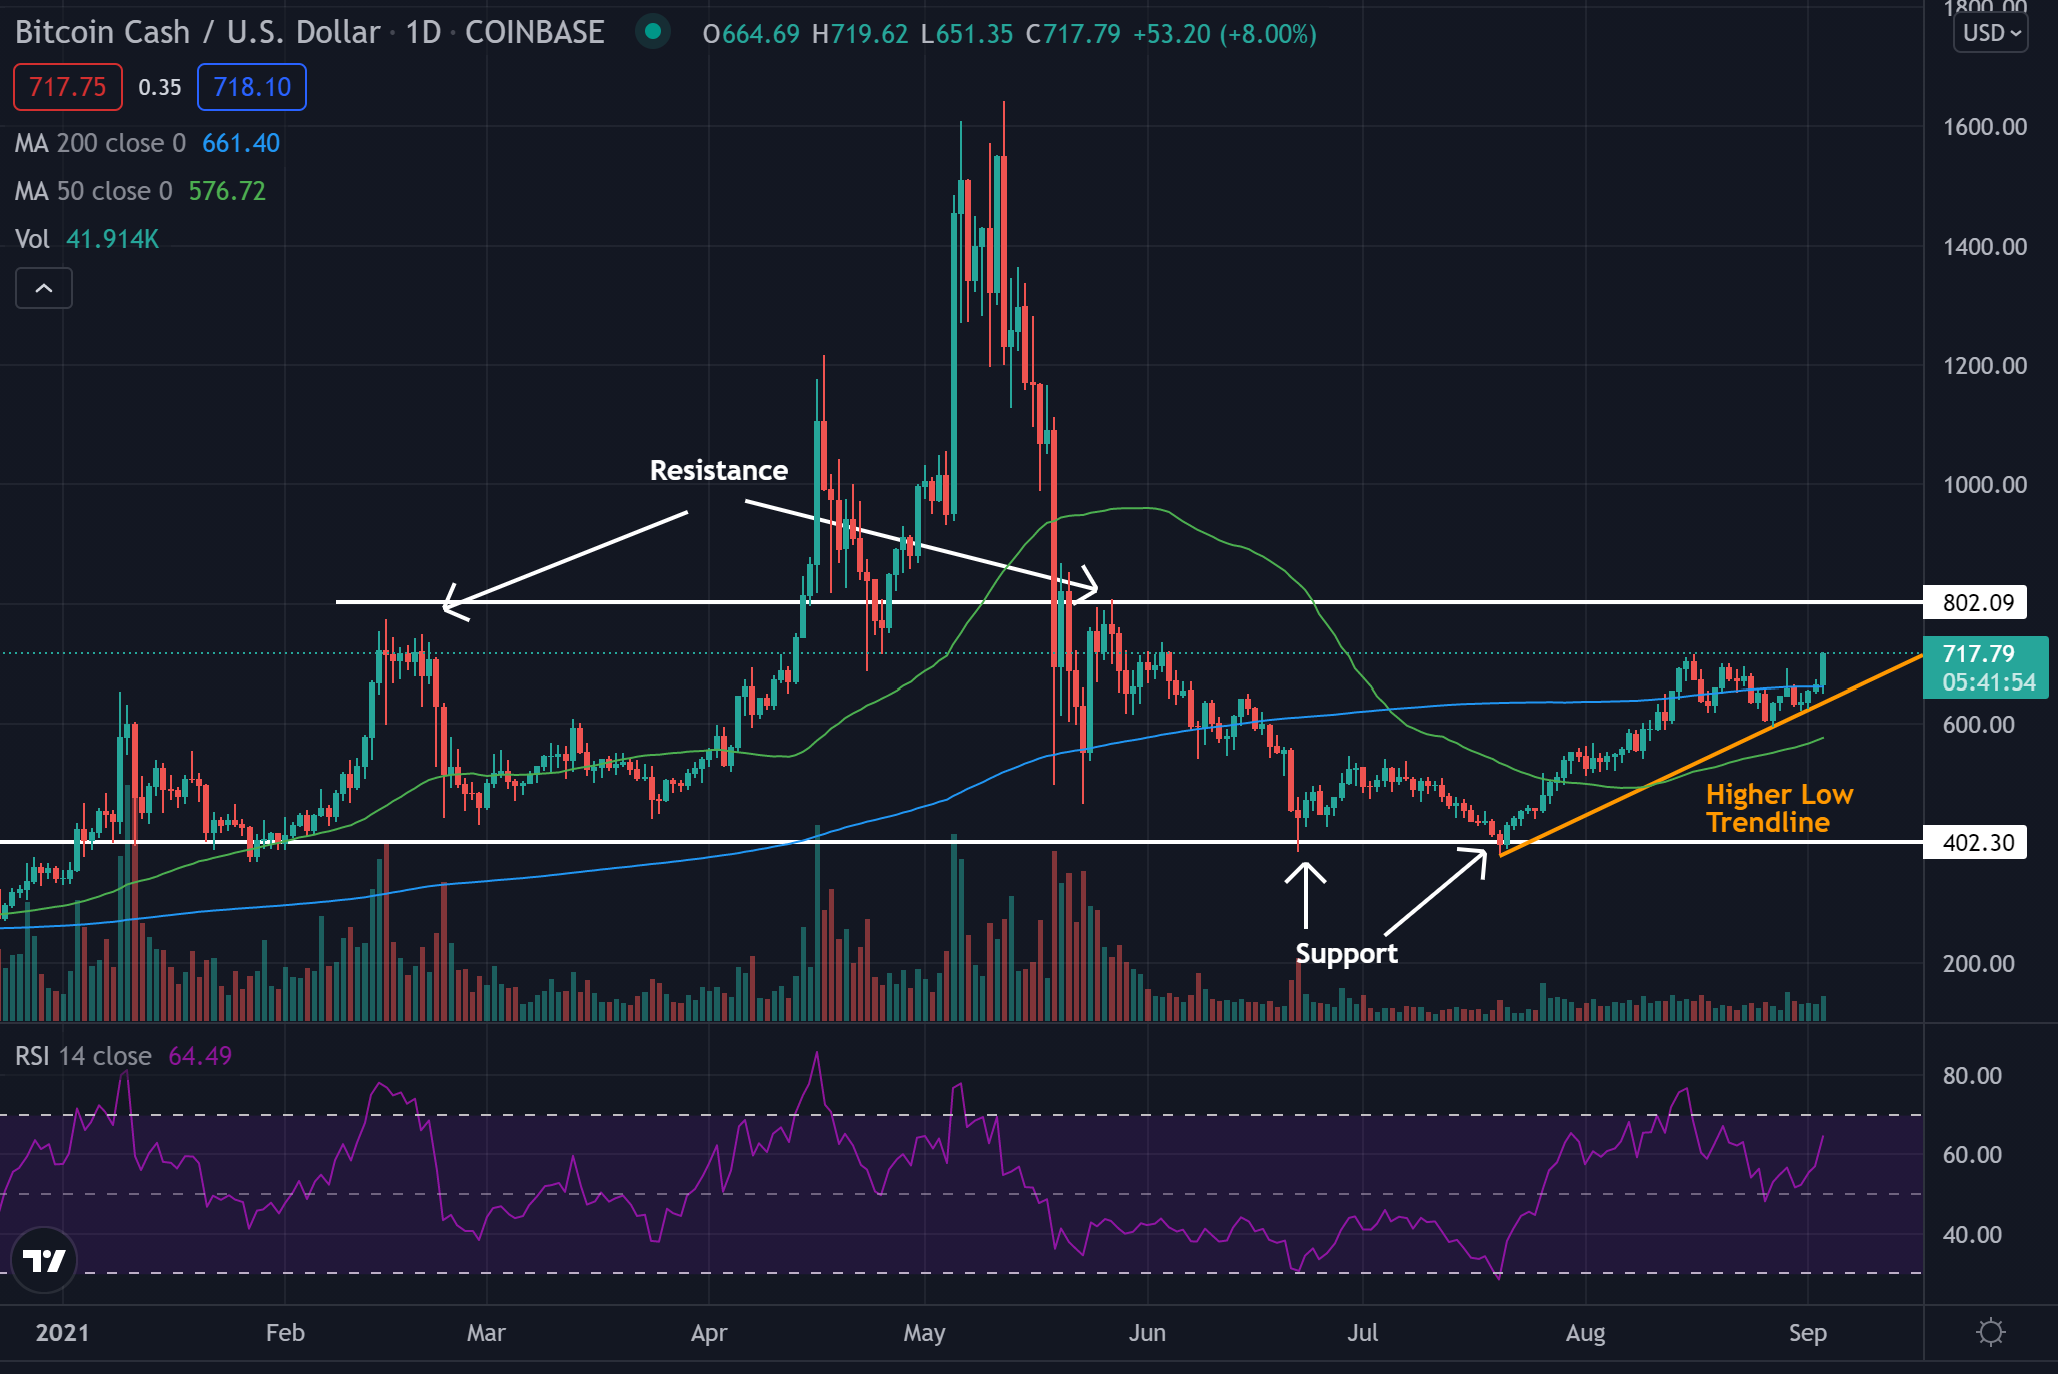
- Bitcoin Cash pushed up farther away from the higher low trendline (orange) and is nearing resistance in what technical traders call an ascending triangle pattern.
- The $800 level is somewhere the crypto struggled to move above in the past, and it may see sellers near this area in the future. The higher low trendline has been the most recent area of support and may continue to hold as support throughout the duration of the pattern.
- The crypto trades above both the 50-day moving average (green) and the 200-day moving average (blue), indicating sentiment in the crypto is bullish.
- Each of these moving averages may hold as an area of support in the future.
- The Relative Strength Index (RSI) pushed higher the past few days and now sits at 64. This shows recently the buying pressure has outweighed the selling pressure.

What’s Next For Bitcoin Cash?
Bullish traders are looking to see Bitcoin Cash trade above the higher low trendline and then go on to break above resistance. Bulls would then want to see the stock consolidate above resistance for Bitcoin Cash to possibly start moving on another leg up.
Bearish traders are looking to see Bitcoin Cash fall below the higher low trendline and move toward the $400 level. Bears would then like to see a break below this $400 support level for a possible continuation lower.
Image: Courtesy Bitcoin Cash
Edge Rankings
Price Trend
© 2025 Benzinga.com. Benzinga does not provide investment advice. All rights reserved.
Trade confidently with insights and alerts from analyst ratings, free reports and breaking news that affects the stocks you care about.