


CME - S&P 500 INDEX CASH– (JUNE) Daily
Near Term Trend: Positive to Neutral
Wednesday's Close: 1385.14 (- 5.70)
Ways to Play this:
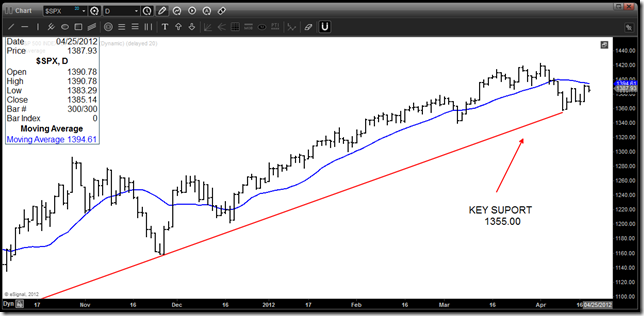 UPDATE: Four weeks ago, we stated, “If the market approaches the 1410.00 region I would expect that area to be the upper limit of this move, and a retrace toward 1360.00 to follow”.
Subsequently, the market collapsed once it hit just above 1410.00, and then retraced down to 1358.00, before bouncing higher.
We have been pretty much spot- on. In addition, I stated I would short the Index on a daily close below 1388.00- not before.
We did that on April 9th as the market settled at 1382.00. We are currently short with a daily stop close only at 1402.40.
UPDATE: Four weeks ago, we stated, “If the market approaches the 1410.00 region I would expect that area to be the upper limit of this move, and a retrace toward 1360.00 to follow”.
Subsequently, the market collapsed once it hit just above 1410.00, and then retraced down to 1358.00, before bouncing higher.
We have been pretty much spot- on. In addition, I stated I would short the Index on a daily close below 1388.00- not before.
We did that on April 9th as the market settled at 1382.00. We are currently short with a daily stop close only at 1402.40.
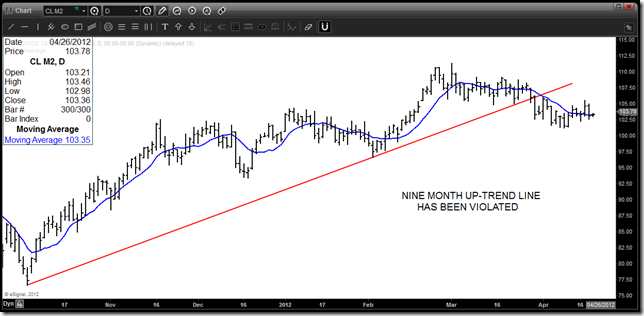 NYMEX - CRUDE OIL (June) - Daily
Near Term Trend: Neutral to Negative
Wednesday's Close: $103.36 (+ $.24 cents)
Ways to Play – SPDR Gold TRUST GLD
UPDATE: Over six weeks ago, we were clear in stating, “We still believe since a weekly settlement above $108.40 has not been posted we could see Crude retrace back toward $100.00”.
The price retraced to a low of $101.22, last week.
Although a bounce above $105.00 took place three days ago, this market is still struggling for now.
NYMEX - CRUDE OIL (June) - Daily
Near Term Trend: Neutral to Negative
Wednesday's Close: $103.36 (+ $.24 cents)
Ways to Play – SPDR Gold TRUST GLD
UPDATE: Over six weeks ago, we were clear in stating, “We still believe since a weekly settlement above $108.40 has not been posted we could see Crude retrace back toward $100.00”.
The price retraced to a low of $101.22, last week.
Although a bounce above $105.00 took place three days ago, this market is still struggling for now.
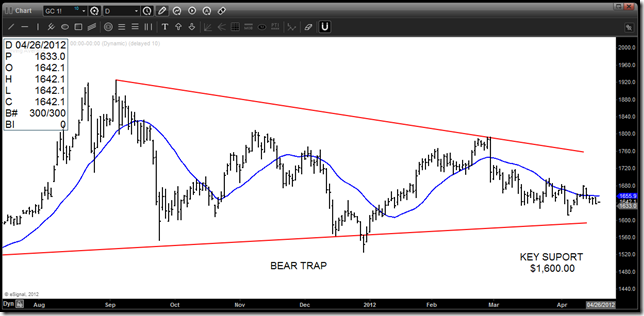 NYMEX - GOLD – Daily
Near Term Trend: Negative
Wednesday's Trade: $1,642.10 (+ $3.30)
Ways to trade - United States Oil Fund USO
UPDATE: Six weeks ago, as the market was trading near $1,710.00, we stated, “Overhead at $1,740.00 could hold, as the market could continue to retrace toward $1,635.00”. Since then, the low has been $1,612.40.
Three weeks ago, we clearly stated, “The challenge will be near term resistance at current levels, up to $1,694.00- resistance at the blue M.A. Line”. We were on point as the high following that statement was $1,697.00, as the market stalled and was hammered once again. & volatility has died. support $1,600.00 is key
NYMEX - GOLD – Daily
Near Term Trend: Negative
Wednesday's Trade: $1,642.10 (+ $3.30)
Ways to trade - United States Oil Fund USO
UPDATE: Six weeks ago, as the market was trading near $1,710.00, we stated, “Overhead at $1,740.00 could hold, as the market could continue to retrace toward $1,635.00”. Since then, the low has been $1,612.40.
Three weeks ago, we clearly stated, “The challenge will be near term resistance at current levels, up to $1,694.00- resistance at the blue M.A. Line”. We were on point as the high following that statement was $1,697.00, as the market stalled and was hammered once again. & volatility has died. support $1,600.00 is key
- SPDR S&P 500 SPY
- ProShares Ultra S&P 500 SSO
- ProShares UltraShort S&P 500 SDS
- ProShares UltraPro S&P 500 UPRO
UPDATE: Four weeks ago, we stated, “If the market approaches the 1410.00 region I would expect that area to be the upper limit of this move, and a retrace toward 1360.00 to follow”.
Subsequently, the market collapsed once it hit just above 1410.00, and then retraced down to 1358.00, before bouncing higher.
We have been pretty much spot- on. In addition, I stated I would short the Index on a daily close below 1388.00- not before.
We did that on April 9th as the market settled at 1382.00. We are currently short with a daily stop close only at 1402.40.
NYMEX - CRUDE OIL (June) - Daily
Near Term Trend: Neutral to Negative
Wednesday's Close: $103.36 (+ $.24 cents)
Ways to Play – SPDR Gold TRUST GLD
UPDATE: Over six weeks ago, we were clear in stating, “We still believe since a weekly settlement above $108.40 has not been posted we could see Crude retrace back toward $100.00”.
The price retraced to a low of $101.22, last week.
Although a bounce above $105.00 took place three days ago, this market is still struggling for now.
NYMEX - GOLD – Daily
Near Term Trend: Negative
Wednesday's Trade: $1,642.10 (+ $3.30)
Ways to trade - United States Oil Fund USO
UPDATE: Six weeks ago, as the market was trading near $1,710.00, we stated, “Overhead at $1,740.00 could hold, as the market could continue to retrace toward $1,635.00”. Since then, the low has been $1,612.40.
Three weeks ago, we clearly stated, “The challenge will be near term resistance at current levels, up to $1,694.00- resistance at the blue M.A. Line”. We were on point as the high following that statement was $1,697.00, as the market stalled and was hammered once again. & volatility has died. support $1,600.00 is key
Editor's Note: Article and charts provided by Chart Lab Pro. Sign up for your FREE 30 day FREE Trial, use the promo code: Chartp2p8i. "The best automated platform for all level investors: www.Chartlabpro.com"
GLDSPDR Gold Trust
$306.00-0.48%
Edge Rankings
Momentum
92.50
Price Trend
Short
Medium
Long
© 2025 Benzinga.com. Benzinga does not provide investment advice. All rights reserved.
Posted In:
Benzinga simplifies the market for smarter investing
Trade confidently with insights and alerts from analyst ratings, free reports and breaking news that affects the stocks you care about.
Join Now: Free!
Already a member?Sign in

