The small-cap blend style ranks tenth out of the twelve fund styles as detailed in my style roadmap. It gets my Dangerous rating, which is based on aggregation of ratings of 27 ETFs and 608 mutual funds in the small-cap blend style as of July 19, 2012. Reports on the best & worst ETFs and mutual funds in every sector and style are here.
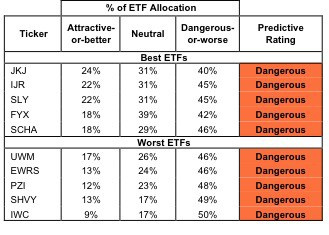
Figures 1 and 2 show the five best and worst-rated ETFs and mutual funds in the style. Not all small-cap blend style ETFs and mutual funds are created the same. The number of holdings varies widely (from 23 to 2035), which creates drastically different investment implications and ratings. The best ETFs and mutual funds allocate more value to Attractive-or-better-rated stocks than the worst, which allocate too much value to Neutral-or-worse-rated stocks.
To identify the best and avoid the worst ETFs and mutual funds within the small-cap blend style, investors need a predictive rating based on (1) stocks ratings of the holdings and (2) the all-in expenses of each ETF and mutual fund. Investors need not rely on backward-looking ratings. My fund rating methodology is detailed here.
Investors should not buy any small-cap blend ETFs or mutual funds because none get an Attractive-or-better rating. If you must have exposure to this style, you should buy a basket of Attractive-or-better rated stocks and avoid paying undeserved fund fees. Active management has a long history of not paying off.
See ratings and reports on all ETFs and mutual funds in this style on my free mutual fund and ETF screener.
Figure 1: ETFs with the Best & Worst Ratings – Top 5
* Best ETFs exclude ETFs with less NAV’s less than 100 million.
Sources: New Constructs, LLC and company filings
Nine ETFs are excluded from Figure 1 because their total net assets (TNA) are below $100 million and do not meet our liquidity standards.
Figure 2: Mutual Funds with the Best & Worst Ratings – Top 5
* Best mutual funds exclude funds with NAV’s less than 100 million.
Sources: New Constructs, LLC and company filings
Forum Funds: Golden Small Cap Core Fund GLDSX, Forward Funds: Forward Focus Funds FFLFX and FLFRX are excluded from Figure 2 because their total net assets (TNA) are below $100 million and do not meet our liquidity standards.
iShares Morningstar Small Core Index Fund JKJ earns my Dangerous rating and is my top-rated small-cap blend ETF. Royce Fund: Royce Value Fund RVFIX earns my Neutral rating and is my top-rated small-cap blend mutual fund.
iShares Russell Microcap Index Fund IWC is my worst-rated small-cap blend ETF and Munder Series Trust: Munder Micro-Cap Equity Fund MMEAX is my worst-rated small-cap blend mutual fund. Both earn a Dangerous-or-worse rating.
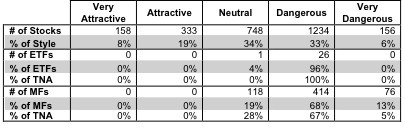
Figure 3 shows that 491 out of the 2629 stocks (27% of the total net assets) held by small-cap blend ETFs and mutual funds get an Attractive-or-better rating. However, none of the 27 ETFs or 608 mutual funds in the small-cap blend style allocate enough value to these 491 stocks to earn an Attractive-or-better rating.
The takeaways are: small-cap blend mutual fund managers pick poor stocks while small-cap blend ETFs offer exposure to poor quality stocks.
Figure 3: Small-cap Blend Style Landscape For ETFs, Mutual Funds & Stocks
As detailed in “Cheap Funds Dupe Investors”, the fund industry offers many cheap funds but very few funds with high-quality stocks, or with what I call good portfolio management.
Investors should not buy any small-cap blend ETFs or mutual funds. None of the 27 ETFs or 608 mutual funds allocate enough value to Attractive-or-better-rated stocks to be deemed investment worthy. Investors seeking exposure to small-cap blend stocks are better off buying individual small-cap stocks. Review my free stock screener for individual stock investments.
GameStop Corporation GME is one of my favorite stocks held by small-cap blend ETFs and mutual funds and earns my Very Attractive rating. GME has generated a return on invested capital (ROIC) over its weighted average cost of capital (WACC) and produced positive economic earnings each of the past nine years. Over that same time frame, GME has managed to grow profits by an average of 31%. Yet, the company’s current stock price (~$16.90) implies that after-tax profits (NOPAT) will permanently decrease by 60%. Its true that GME is competing with the likes of Wal-mart, Target, Best Buy and Amazon, which has caused downward pressure on pricing, but a 60% decrease in profits is extreme given GME’s historical performance. GME offers investors a great risk/reward tradeoff because investors will realize price appreciation if GME’s profits decrease by anything less than 60%.
Rowan Co Plc RDC is one of my least favorite stocks held by small-cap blend ETFs and mutual funds and earns my Very Dangerous rating. RDC has misleading earnings, meaning that it reports earnings that are positive and rising while its economic earnings are negative and declining. In fact, the company has had negative economic earnings in 10 of the past 14 years. Over the past five years, the company’s ROIC has plummeted from a respectable 14.3% to a meager 0.9%. And yet, the market is taking an optimistic view of RDC’s future cash flows. To justify its current stock price (~$34.61), the company must grow profits by 12.4% compounded annually for 32 years. This is a high hurdle given that the company has averaged negative 39% growth in profits over the past three years.
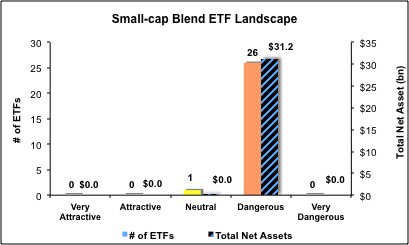
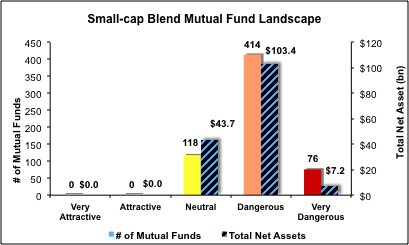
Figures 4 and 5 show the rating landscape of all small-cap blend ETFs and mutual funds.
Our style roadmap report ranks all styles and highlights those that offer the best investments.
Figure 4: Separating the Best ETFs From the Worst Funds
Figure 5: Separating the Best Mutual Funds From the Worst Funds
Review my full list of ratings and rankings along with free reports on all 27 ETFs and 608 mutual funds in the small-cap blend style.
Disclosure: I receive no compensation to write about any specific stock, sector, style or theme.
Edge Rankings
Price Trend
© 2025 Benzinga.com. Benzinga does not provide investment advice. All rights reserved.
Trade confidently with insights and alerts from analyst ratings, free reports and breaking news that affects the stocks you care about.


