

This post contains sponsored advertising content. This content is for informational purposes only and not intended to be investing advice.
Financial market practitioners frequently observe that market liquidity decreases when a bout of heightened volatility confronts markets. The inverse relationship between volatility and liquidity is evident and logical for tradeable products when one considers prudent risk management requirements of liquidity providers. Highly liquid benchmark products at CME Group are no exception. Indeed, commentators reported the reduced book depth and the widening of effective bid/ask spreads in E-mini S&P 500 futures in January 2022 at the same time that volatility reached multi-year highs. This spike in volatility and the predictable decrease to liquidity causes many to reminisce the unwavering E-mini S&P 500 futures markets that are typically 1-tick wide and a few hundred contracts on bids and offers, going back years and years during normal levels of volatility, but no longer the case during this latest bout of volatility.
Over the long term, it is relatively easy to lose sight of the fact that equity indexes have traversed a very broad trading range in recent years. This broad price range does have an impact on the perceived liquidity if one only considers the number of contracts on bid and offer in the order book.
To illustrate, one can consider two distinct points in time at which the S&P 500 Index was at 2,000 and 4,000 points respectively. With a multiplier of $50 per contract, the E-mini S&P 500 futures would have, correspondingly, notional value of $100,000 and $200,000.
Since the trading tick of 0.25 index point is invariant to the level of the index, the tick size is 1.25 and 0.625 basis point of notional value when the index was at 2,000 vs 4,000. Thus, in notional terms, the tick size at the index level of 4,000 is one half of that at the index level of 2,000. At the same time, each one contract on bid/offer at the index level of 4,000 is twice as large in notional value when compared to the latter. One should readily conclude that it would not be helpful to simply look at the top of the book quantity to judge liquidity, especially over the long run.
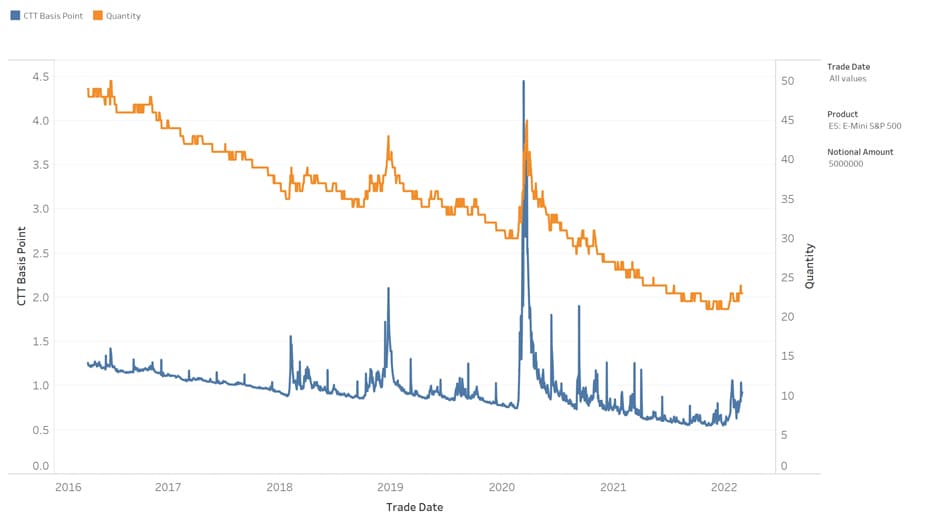
Accounting for the effects of the notional value changes, the graphs in Figure 1 provide a longer-term liquidity perspective on E-mini S&P 500 futures (ES) market. The four panels of figure 1 show the round-trip cost to trade for ES contracts at a notional size of $1-, $5-, $10- and $25-million (blue lines) as well as the number of ES contracts to achieve the notional size (orange lines).
As the index value increases over time, the number of ES contracts to achieve each fixed notional value decreases. From the upward spikes of the orange lines, one can also deduce when the market exhibited violent corrections. The most prominent example was certainly that of the March 2020 episode, when the market was dealing with a very abrupt market turmoil associated with the COVID-19 pandemic and the corresponding social lockdown measures;
The round-trip cost to trade (CTT) associated with the four fixed trade sizes all exhibited the expected slow downward trend due to the fixed tick size in the ES market. For example, over the 5-year period depicted in the graphs, the CTT for a $25-million trade in ES was in the range of 1 to 1.5 basis points, with occasional spikes.
The spikes in the CTT lined up with the market turmoil indicated by the spikes in the orange lines, with the most prominent degradation in liquidity recorded during the March 2020 episode. Indeed, that was the only episode within the 5-year period in which the equity market circuit breaker rules had been triggered.
Figure 1. Cost to Trade measure of CME E-mini S&P 500 futures – front month contract, with notional trade size of $1m

Source: CME Group
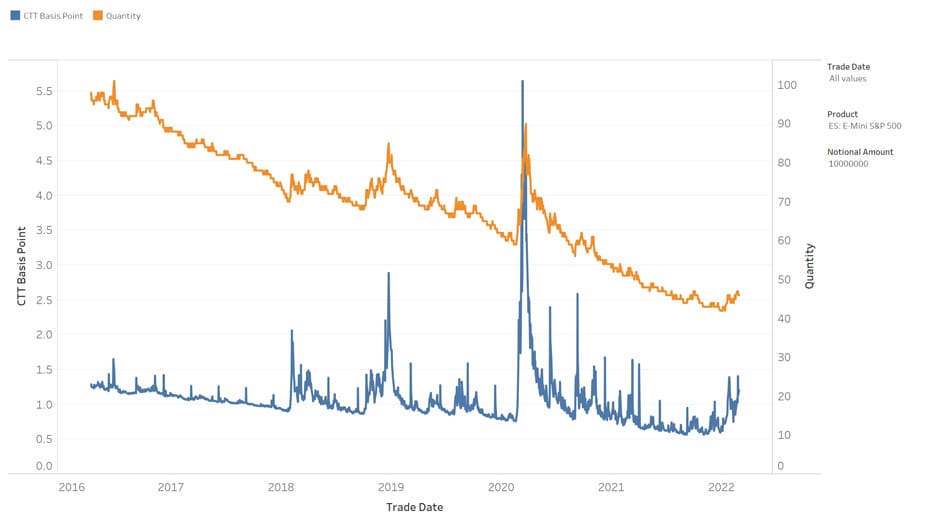
Figure 2. Cost to Trade measure of CME E-mini S&P 500 futures – front month contract, with notional trade size of $5m
Source: CME Group
Figure 3. Cost to Trade measure of CME E-mini S&P 500 futures – front month contract, with notional trade size of $10m
Source: CME Group
Figure 4. Cost to Trade measure of CME E-mini S&P 500 futures – front month contract, with notional trade size of $25m
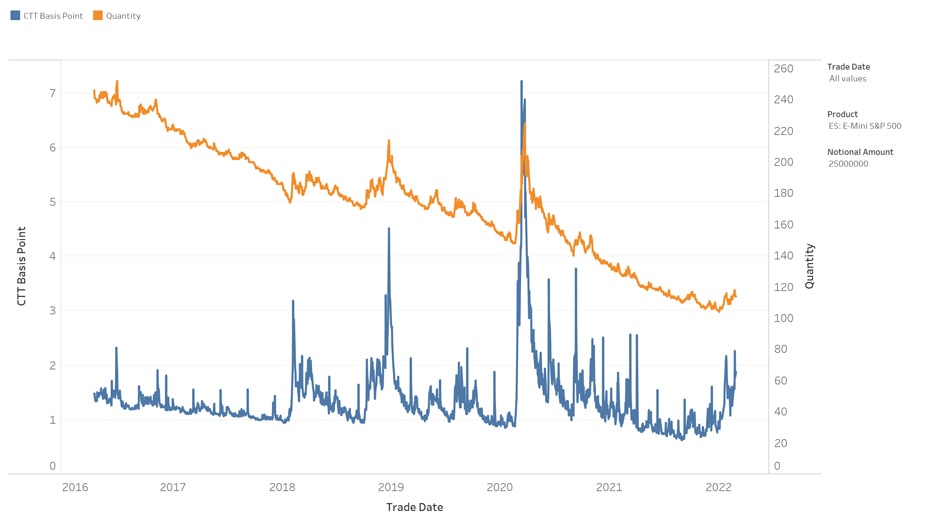
Source: CME Group
Legend – blue line: immediate round-trip cost to trade measured in basis points (left vertical axis); orange line: number of front month E-mini S&P 500 futures to achieve notional size of trade (right vertical axis)
The translation of the liquidity into these CTT measures put the January 2022 market liquidity performance into perspective:
While the smaller trade sizes have not seen very significant impact, the CTT visibly increased for larger trades; for example, a $25-million trade increased from a round-trip cost of sub-1 basis point in 2021 to over 2 basis point during the spike.
- Cost to trade on a notionally-adjusted basis was LOWER during the heightened volatility period of January 2022 versus all prior full-year periods.
- However, the liquidity crunch was far from outsized in relation to similar events in the recent past. In fact, one can argue that the liquidity crunch in most of the recent episodes were worse than that of the January 2022 vintage.
- The graphs also confirm another important observation – that market liquidity tends to be restored quickly. Rather than the CTT measure plateauing at a higher level after the shocks, it quickly reverted to the trend levels.
This post contains sponsored advertising content. This content is for informational purposes only and not intended to be investing advice.
© 2025 Benzinga.com. Benzinga does not provide investment advice. All rights reserved.
Trade confidently with insights and alerts from analyst ratings, free reports and breaking news that affects the stocks you care about.

