

The optimism that swept through the crypto space following President Donald Trump's election win has quickly collided with market reality. Once hailed as a champion of digital assets—vowing to make the U.S. the “crypto capital of the planet”—Trump's recent rollout of broad global tariffs has shaken investor confidence, sending shockwaves through both traditional and crypto markets.
Bitcoin, which surged to a record high of nearly $110,000 during the inauguration hype in January, has since retraced sharply, dropping over 10% to fall below the $78,000 mark.
Don't Miss:
- ‘Scrolling To UBI' — Deloitte's #1 fastest-growing software company allows users to earn money on their phones. You can invest today for just $0.26/share with a $1000 minimum.
- Maker of the $60,000 foldable home has 3 factory buildings, 600+ houses built, and big plans to solve housing — this is your last chance to become an investor for $0.80 per share.
Often viewed as both a hedge against traditional finance and a speculative asset sensitive to liquidity flows, BTC now sits at a critical juncture. The charts are beginning to reflect the tension, with key technical levels taking shape that could dictate the next major move. In this piece, we'll break down the most important areas to watch on the Bitcoin chart and what they might tell us in the days and weeks ahead.
Monthly Chart
Zooming out is always important, as it provides a clearer picture of the overall direction of a market by reducing short-term noise. From the lows of November 2022 to the highs reached in January, Bitcoin surged by an impressive 611%.
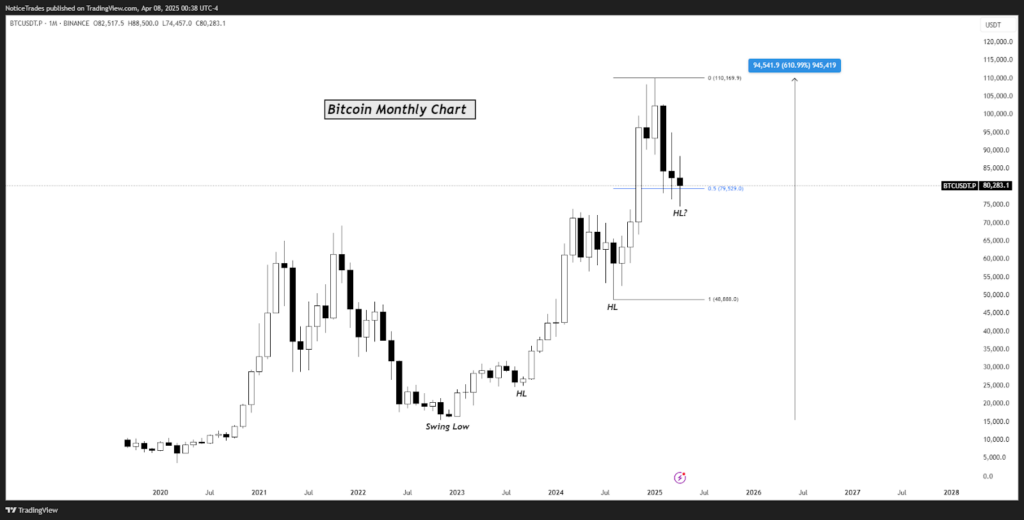
Source: TradingView (User & Screenshot – NoticeTrades)
Trending: BlackRock is calling 2025 the year of alternative assets. One firm from NYC has quietly built a group of 60,000+ investors who have all joined in on an alt asset class previously exclusive to billionaires like Bezos and Gates.
What's important on the monthly chart is the current structure that has been forming since the 2022 bottom. The market has consistently maintained a higher low trend relative to previous swing lows.
Bitcoin is currently trading at $80,200 as of Tuesday, which is a crucial level to hold. This level represents the 50% retracement of $79,500 from the previous swing low to the all-time high. It serves as a natural support level where, as an investor or trader, you'd want to see demand.
Weekly Chart
Zooming in a little closer to the weekly timeframe, we can see more detail regarding the structure that formed the monthly swings.
As of the current price action, BTC is holding well above the 50 EMA, which aligns with the 50% retracement level of the overall trading range.
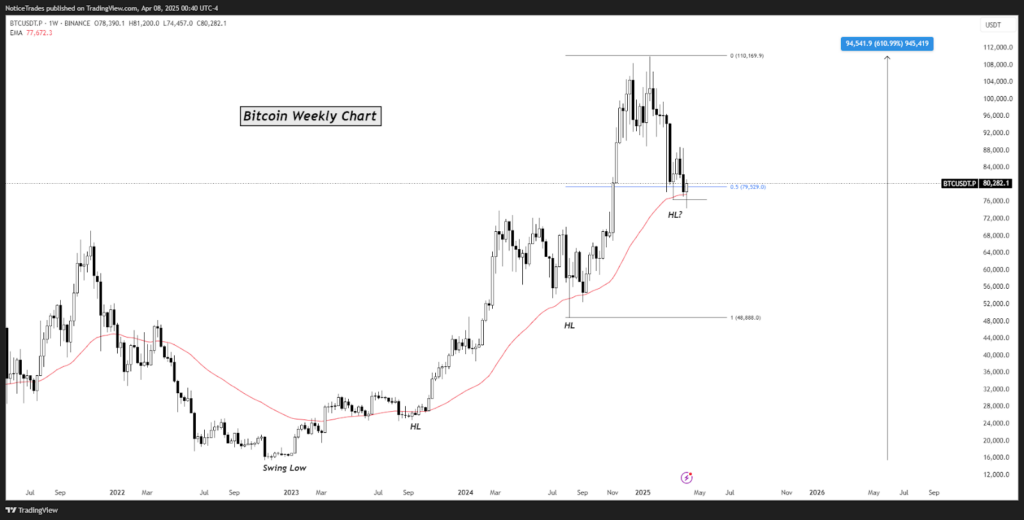
Source: TradingView (User & Screenshot – NoticeTrades)
Areas to watch on the weekly chart include the 50 EMA and the strength around the current swing. For any continuation in the short to mid-term, price would need to form a higher low here.
If the price starts falling below the 50 EMA and continues the overall daily trend, which I will discuss in the next section, we can expect a move down towards the November low.
If the price starts falling below the 50 EMA and continues the overall daily trend, which I will discuss in the next section, we can expect a move down towards the November low.
See Also: Are you rich? Here’s what Americans think you need to be considered wealthy.
Daily Chart
Since mid-January, Bitcoin has been in a bearish market—characterized by the market attacking lows and leaving behind protected highs, which are lower highs. On Sunday, Bitcoin made a run toward the swing low around $76,500 but failed to close below it, which could be a potential sign of strength or demand.
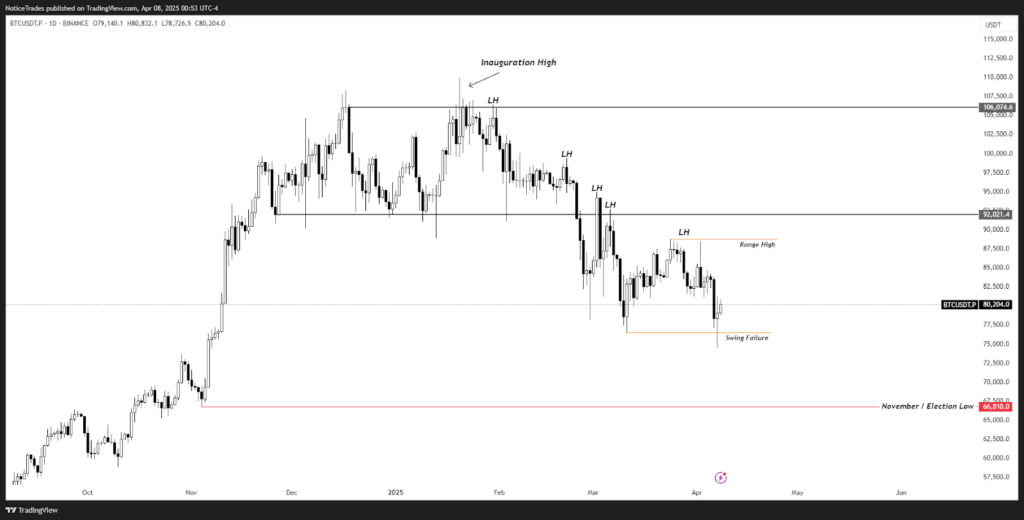
Source: TradingView (User & Screenshot – NoticeTrades)
What is key to watch here on the daily chart?
Since the trend is still bearish, the first detail to look for is a break above a lower high to indicate a potential shift in trend. That level is currently at $88,000. You would want to see price move above the range highs and not reject, as the market did during the inauguration.
The potential bull case still stands in my view as long as Bitcoin continues to show relative strength above the Election/November low. However, as mentioned, if the price breaks below the 50 EMA on the weekly, I'd expect that to be the next downside target before any sort of high-time-frame bounce.
Read Next:
- Have $200K saved? Here's how to turn it into lasting wealth
- Inspired by Uber and Airbnb – Deloitte's fastest-growing software company is transforming 7 billion smartphones into income-generating assets – with $1,000 you can invest at just $0.26/share!
© 2025 Benzinga.com. Benzinga does not provide investment advice. All rights reserved.
Trade confidently with insights and alerts from analyst ratings, free reports and breaking news that affects the stocks you care about.

