Three major real estate investment trusts (REITs) are hitting new 2022 lows as investors unload in the classic just-get-me-out fashion.
American Tower Corp. AMT, Digital Realty Trust Inc. DLR and Medical Properties Trust Inc. MPW just can’t stop going down lately.
The interest rate hikes made by the Federal Reserve Board seem to be hitting this sector hard. Each of these REITs already was declining, but the new lows this week are harsh reminders of the steady downtrend. Many other stock sectors are bouncing off of oversold levels, but this group can’t even do that.
See also: Best REITs to Buy in 2022
Take a look at the daily price chart for American Tower Corp.:
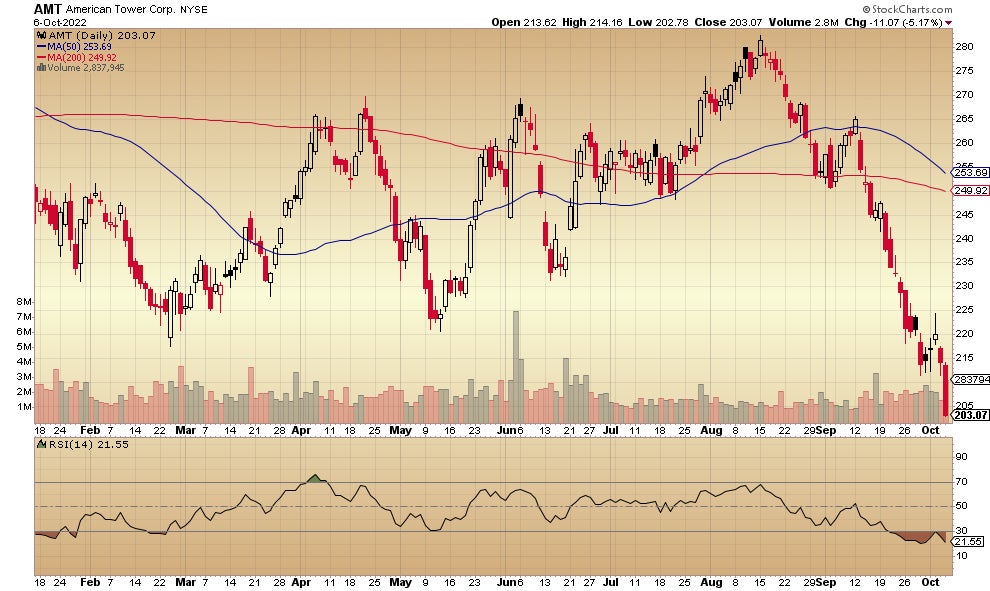
That big red bar on Oct. 6 demonstrates the ferociousness of the selling. Even though it’s already in the oversold territory on the relative strength indicator (RSI), below the price chart, many more sellers than buyers are participating. Note that both the 50-day moving average and the 200-day moving average are trending downward.
This is the weekly price chart for American Tower Corp.:
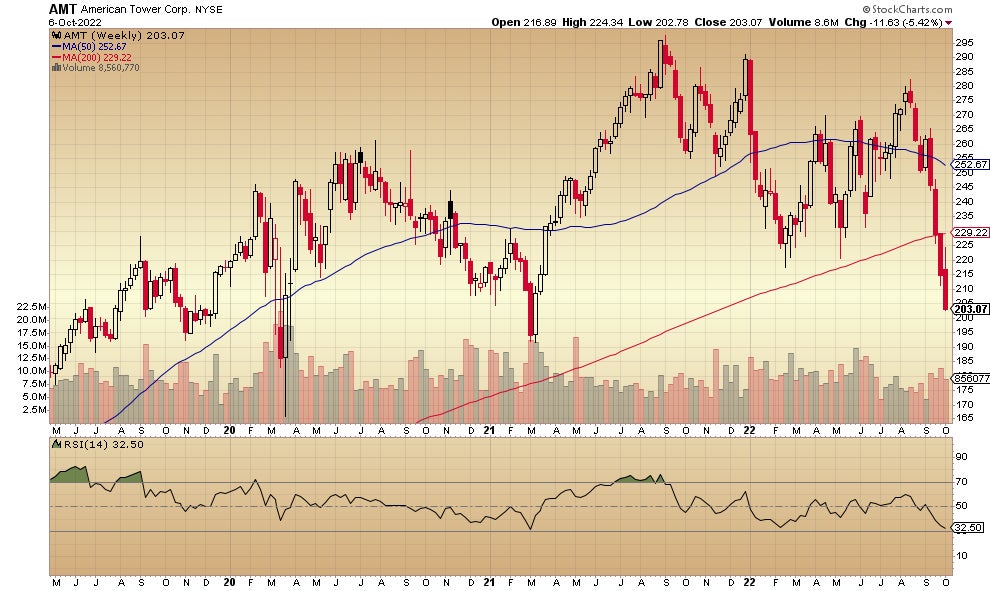
This week’s selling and last week’s selling have taken the price to a level beneath the 200-week moving average (the red line), not typically a good sign.
Here’s the daily price chart for Digital Realty Trust Inc.:
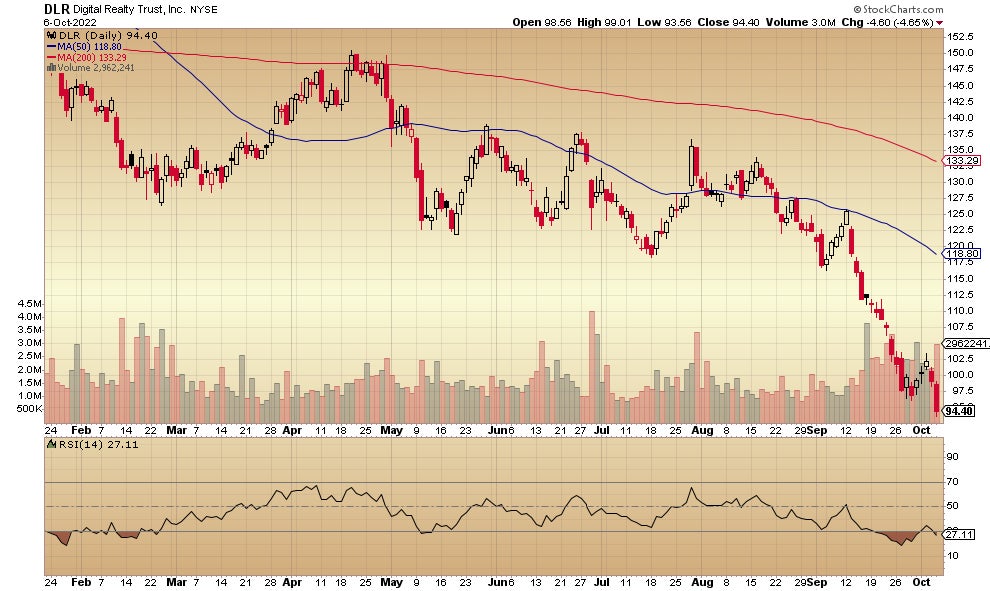
That the increase in volume, as indicated by the red Oct. 6 selling bar, comes with the lower low and confirms how bearish investors have become on the prospects for this REIT. This is another case of both the significant moving averages heading downward — in this case, for a few months now. Digital Realty is paying a 4.93% dividend.
This is the weekly price chart:
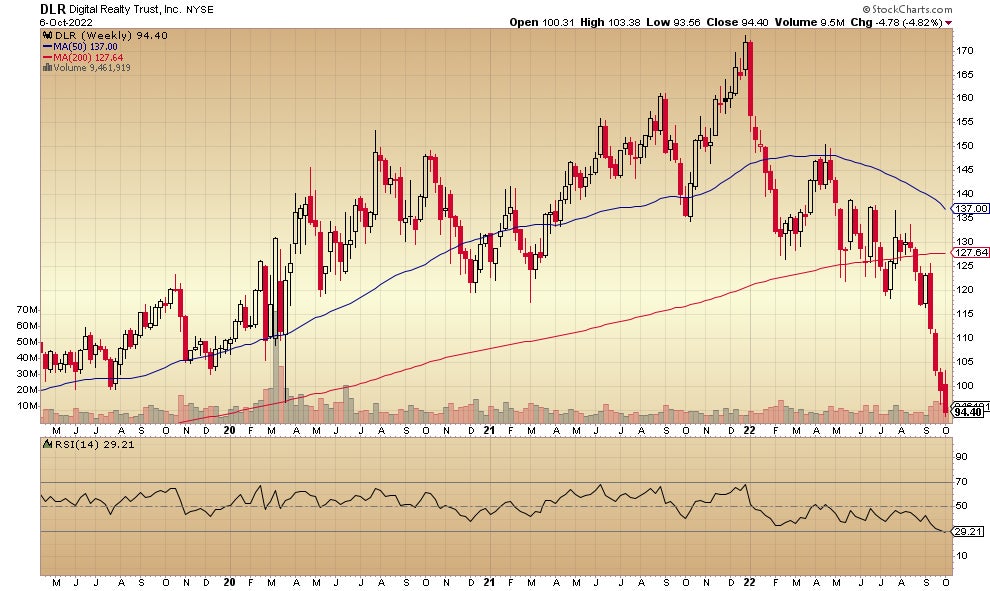
The Oct. 6 selling has taken the price to a level below that of the March 2020 drop resulting from the COVID scare.
This is the daily price chart for Medical Properties Trust Inc.:
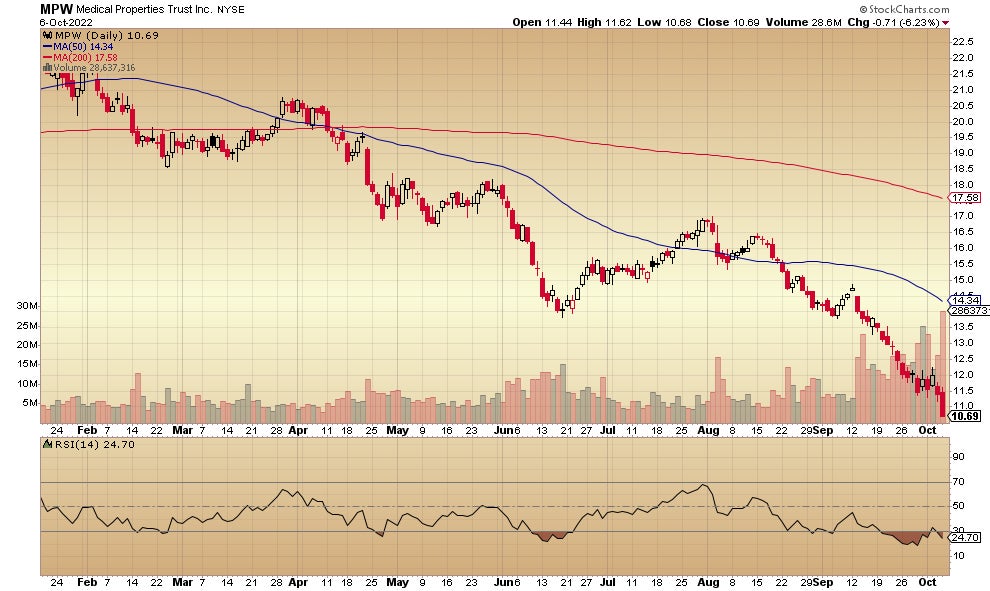
The increase in selling volume on Oct. 6 is apparent on this chart, with the big red volume bar scaling the heights. The lower low is equally as apparent even though the REIT had been in the oversold range on the RSI reading for the days in advance. It’s a bearish sign that both the 50-day and the 200-day moving averages are dropping further.
Check out: This Little-Known REIT Has Produced Double-Digit Annual Returns For The Past Five Years
Here’s the weekly price chart:
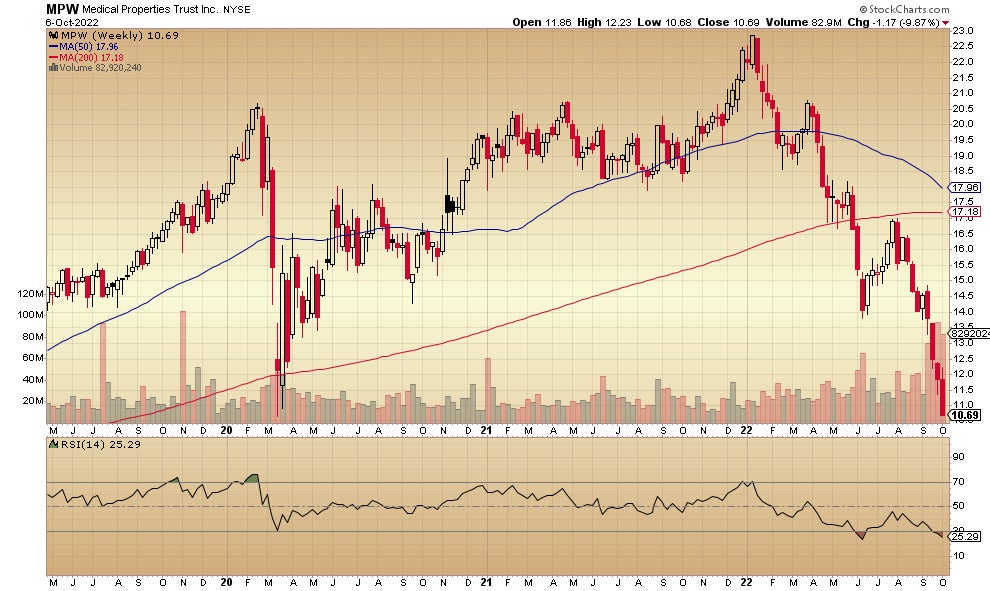
Note that the Oct. 6 drop takes it below the March 2020 pandemic scare lows.
Medical Properties Trust pays a 10.18% dividend at this price. Whether this level of payment can be maintained is a good question for investors to be asking.
Read next: This Company Is Offering Passive Real Estate Investments At 2021 Prices
Not investment advice. For educational purposes only.
Edge Rankings
Price Trend
© 2025 Benzinga.com. Benzinga does not provide investment advice. All rights reserved.
Trade confidently with insights and alerts from analyst ratings, free reports and breaking news that affects the stocks you care about.