With interest rates easing off of their recent highs, including the 10-year U.S. Treasury Note yield (now back under 4%) and the 30-year fixed-rate national average mortgage rate (now back below 7%), real estate investment trusts (REITs) may be perking up.
Is a bottom finally in store or is it just one more relief rally?
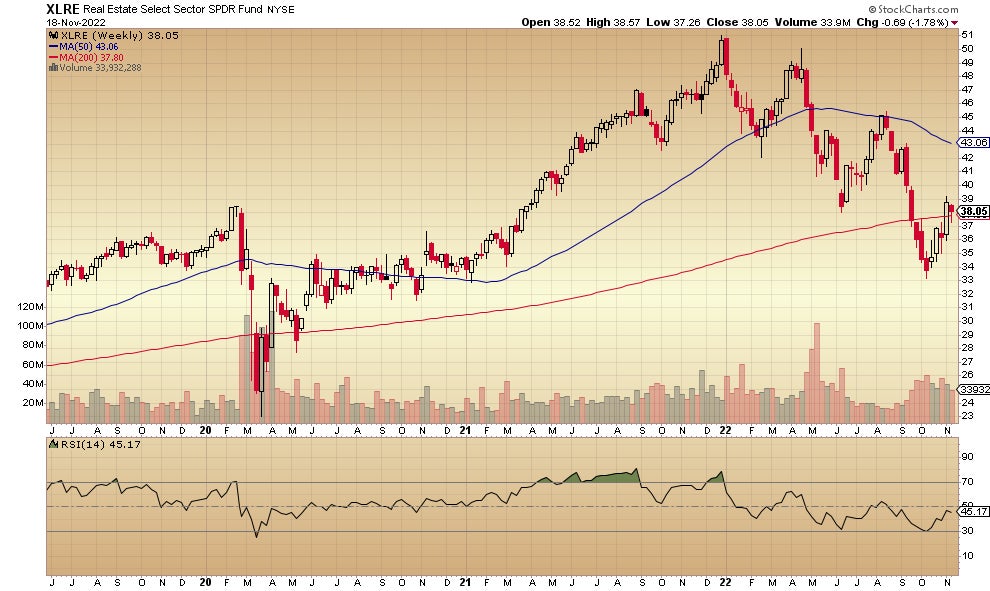
One quick way to measure strength or weakness in the entire REIT group is to take a look at the Real Estate Select Sector SPDR Fund XLRE. This exchange-traded fund (ETF) has 34 real estate investment trust holdings and is generally considered a benchmark for movements in the sector.
Here’s the weekly price chart:

Not only is it steadily upward off of the mid-October low price, it’s crossed back above a slightly uptrending 200-week moving average. Also, there seems to be a positive price divergence emerging on the relative strength indicator (RSI) below the price chart. The next step for bulls would be for the fund to make it above the 50-week moving average and stay there long enough to turn that indicator upward again.
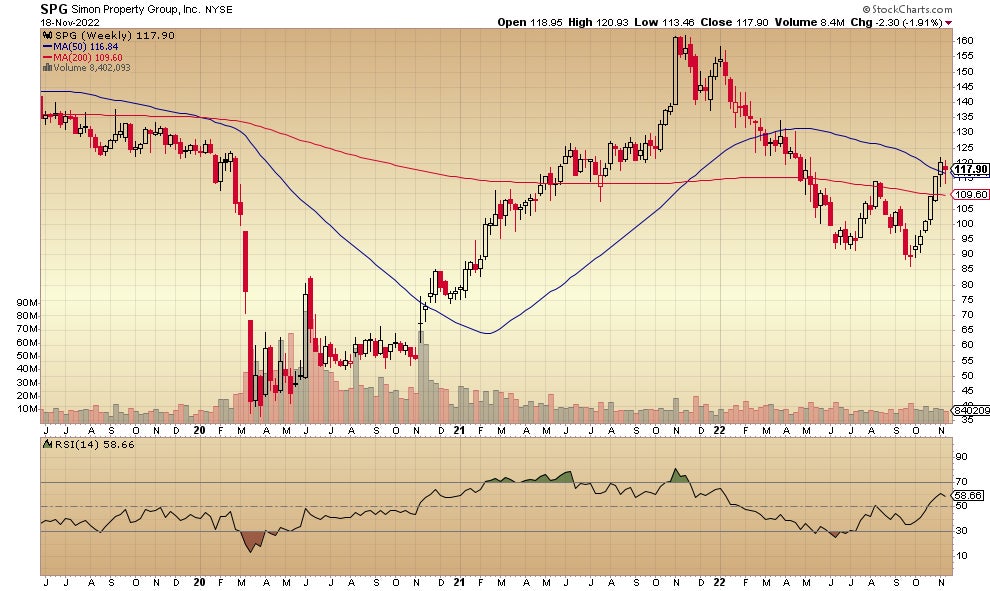
Simon Property Group Inc. SPG is one of the larger components of the Real Estate Select Sector SPDR Fund, with a market capitalization of $38.6 billion. The weekly price chart is here:

The price managed to cross back above both the 200- and the 50-week moving averages. Both continue to trend downward, but this is progress, as long as it continues. Note the positive divergence on the relative strength chart — a higher RSI reading even though the September low came in lower than the June and July lows.
Simon Property pays a dividend of 6.22%.
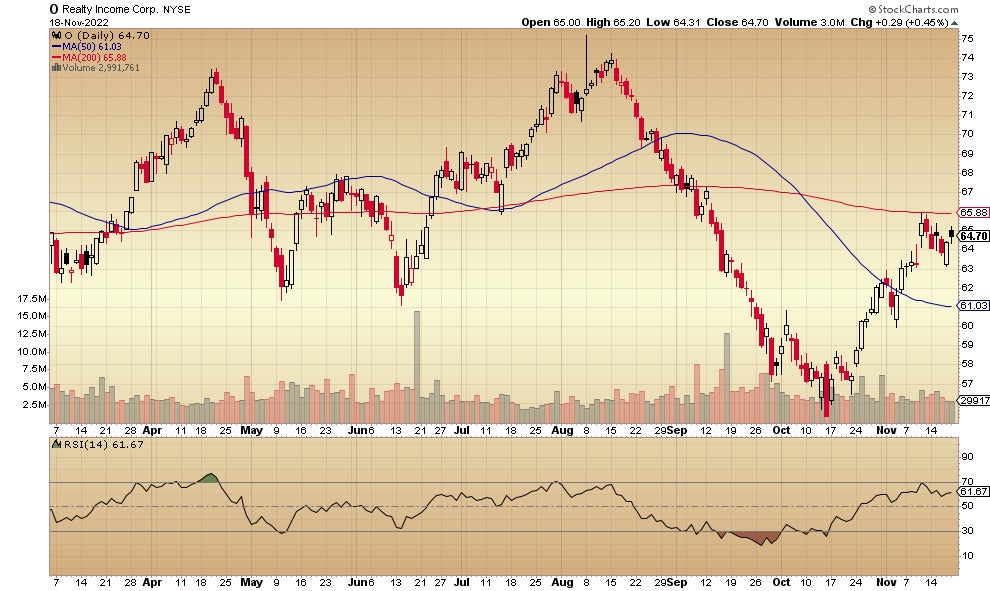
Realty Income Corp. O has a market capitalization of $40.6 billion, making it another of the major REITs to watch. The weekly price chart looks like this:

After that massive slide in price from early August all the way into mid-October, buying interest is showing up again in this REIT. It’s back above the 50-week moving average and recently just touched the 200-week moving average. Realty is paying a 4.62% dividend at this price.
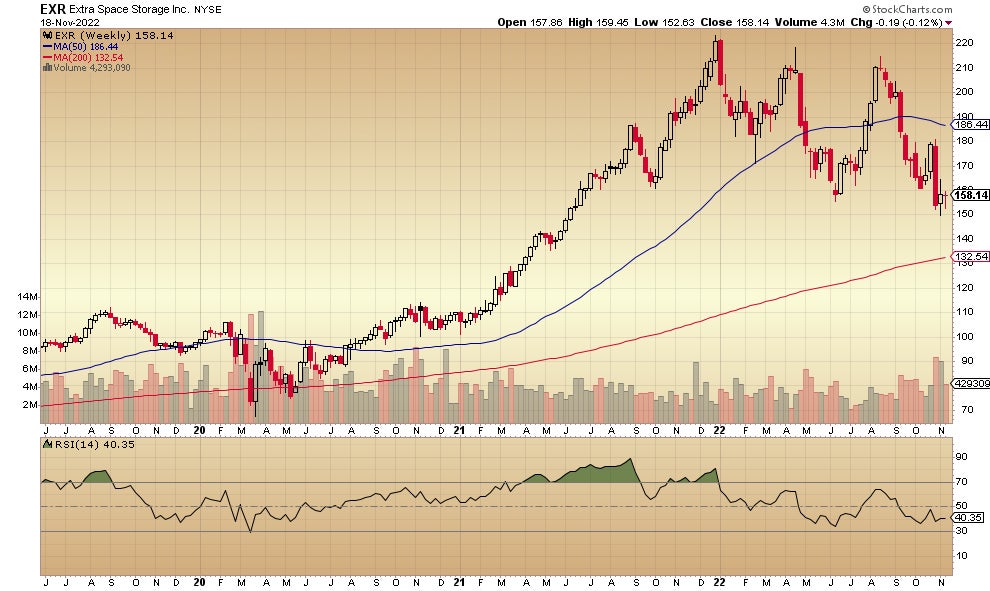
Extra Space Storage Inc. EXR is another major REIT with a market capitalization of $21.2 billion. Here is the weekly price chart:

This REIT never fell as dramatically as the others, but it’s not rallying back as strongly either. The price remains steadily above a rising 200-week moving average, a bullish indicator. It would be better for investors to see it rise and stay above the 50-week moving average so that a trend reversal might be clear.
Extra Space Storage pays a 3.86% dividend.
REITs are one of the most misunderstood investment options, making it difficult for investors to spot incredible opportunities until it’s too late. Benzinga’s in-house real estate research team has been working hard to identify the greatest opportunities in today’s market, which you can gain access to for free by signing up for Benzinga’s Weekly REIT Report.
Charts courtesy of StockCharts
© 2025 Benzinga.com. Benzinga does not provide investment advice. All rights reserved.
Trade confidently with insights and alerts from analyst ratings, free reports and breaking news that affects the stocks you care about.