


When the 50-day moving average crosses above the 200-day moving average, it’s considered bullish by technical analysts. The price has finally stopped going down over the short term and is headed back up enough to take it back above the long-term trend.
Some analysts refer to this as a golden cross, but whatever it’s called, it’s a generally positive signal for real estate investment trusts (REITs). Heading into the release of the consumer price index on Tuesday, things could change. If inflation numbers are high enough for the Federal Reserve to raise rates further and faster, that might negatively affect this sector.
In the meantime, here are the three REITs showing golden cross chart patterns:
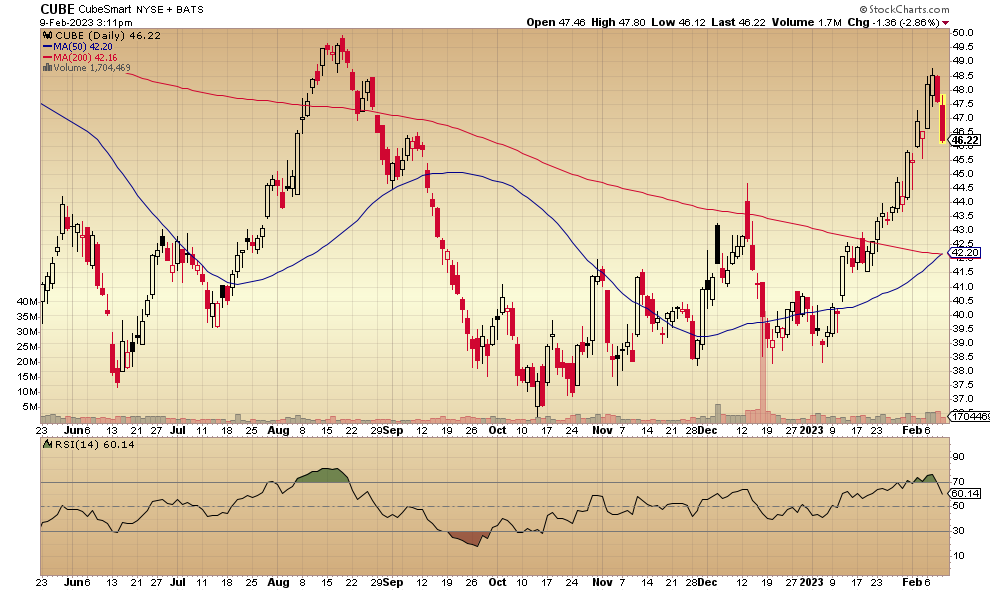
CubeSmart CUBE is a self-storage real estate investment trust with more than 1,000 properties across the U.S. Its market capitalization is $10.4 billion. With a price-earnings ratio of 40, the REIT trades at 3.63 times its book value. Funds from operations (FFO) were up 28% in 2022 and up 19% over the past five years. CubeSmart pays a dividend of 4.27%.
Here’s the daily chart showing the 50/200 daily moving average crossover:
NetSTREIT Corp. NTST is a smaller REIT with a market capitalization of $1.07 billion. The Dallas-based company owns single-tenant net-lease properties. NetSTREIT trades at 2% discount from its book value with funds from operations from 2022 coming in at 222%. The company is paying a dividend of 4.13%.
The daily price chart looks like this:

Prologis Inc. PLD is one of the major publicly traded real estate investment trusts with a market capitalization of $120.77 billion. The price-earnings ratio is 29, and it trades at 2.69 times its book value. Funds from operations in 2022 were 96% and over the past five years were up by 11.7%. This industrial REIT pays a 2.47% dividend.
The daily chart showing the 50/200 daily moving average crossover is here:

Investors should closely follow how these REITs perform following the Tuesday release of the consumer price index.
Not investment advice. For educational purposes only.
Weekly REIT Report: REITs are one of the most misunderstood investment options, making it difficult for investors to spot incredible opportunities until it’s too late. Benzinga’s in-house real estate research team has been working hard to identify the greatest opportunities in today’s market, which you can gain access to for free by signing up for Benzinga’s Weekly REIT Report.
Check Out More on Real Estate from Benzinga
Edge Rankings
Price Trend
© 2025 Benzinga.com. Benzinga does not provide investment advice. All rights reserved.
Trade confidently with insights and alerts from analyst ratings, free reports and breaking news that affects the stocks you care about.

