As a value investor, you will want to determine if the market price of a stock is overvalued, undervalued or fairly valued. One way to do this is by comparison analysis of a stock's valuation multiples. In this example, I will take a look at Alphabet Inc GOOG GOOGL through a stock valuation multiples approach.
First, you will want to find out how the current stock price compares to a historical benchmark. A historical benchmark will provide a way to measure if a stock's valuation has diverged from what it typically traded. It’s within these divergences that we look for potential opportunities.
Let’s use GOOG P/E and P/S historical multiples to derive an implied value.
Google Historical Multiples

Source: Market Chameleon
Compare Historical vs Current Multiples
From the table above, we can easily compare GOOG’s 3-year historical average P/E vs its current P/E, which is 35.4 vs 35.3, respectively. Similarly, we compare the current P/Sales ratio vs the 3-year historical average, which is 8.3 vs 6.2, respectively. Therefore, we know that the current P/E is inline with the historical average and that the current P/S is above the historical average. Keep this in mind for later.
Compare GOOG vs the Market
We also want to compare Google's current and historical multiples relative to the rest of the market.
We can see from the data above that GOOG P/E on average traded at a 27% premium to the SPY (S&P 500 ETF) P/E. But, it is currently trading at a -5% discount. Based on a historical benchmark, this indicates that GOOG is currently at an attractive valuation. However, the P/Sales ratio has expanded to +186% premium to SPY while on average the premium was +144%. Taking different multiples into account becomes important for such a scenario. Therefore, we come up with an implied stock price value using these various ratios, and compare it to the current market stock price.
If we use the historical benchmarks and take the average valuation we can calculate the implied value of GOOG, which comes out to be $2039.44 (ranging between $1541.43 to $2781.15).
This happens to be close to the current price and indicates that GOOG is currently fairly priced.

Source: marketchameleon.com
We do not want to stop at the implied value. Besides comparing market price vs implied valuation, we want to consider the company's ability to grow its earnings and revenue. Is GOOG justified to trade at a higher or lower valuation?
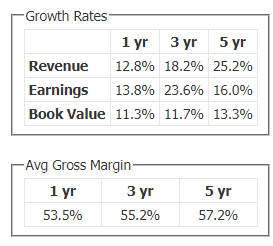
In the following table, we can see that GOOG had double-digit growth (on average) in its revenue and earnings on a 1-year, 3-year and 5-year basis. In addition, Google has maintained a healthy gross margin above 50%.
Google Revenue and Earnings Growth and Gross Margin

Source: Market Chameleon
Let’s compare this with the rest of the market through SPY (our benchmark).
SPY Revenue and Earnings Growth

Source: Market Chameleon
SPY total revenue and net income has declined in the last year and the 5 year average growth was in the low single digits. Google clearly has much better growth.
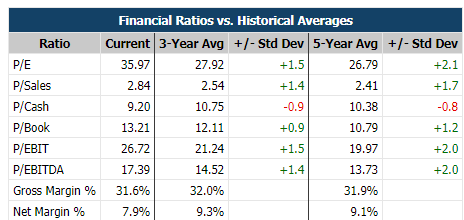
Let’s take a look at the P/E and gross margins of SPY vs historical metrics.
SPY Multiples and Margins

Source: Market Chameleon
We can see that the SPY P/E ratio has expanded to 35.97 from a 3 year average of 27.92 (a 22% expansion), while Google P/E is near its 3-year average (as shown previously). If google had the same P/E expansion, the P/E would be approximately 43. That P/E would imply that the price should be closer to $2,494. What makes Google even more attractive is, not only has it managed to grow its earnings faster, but its gross margins look much better at 53.5% vs SPY 31.6%.
Value Opportunity
In conclusion, if we use historical multiples, GOOG appears to be fairly valued. But if we make a comparative analysis vs the rest of the market (considering growth and profit margins), GOOG comes up on top, making an attractive relative value opportunity.
© 2025 Benzinga.com. Benzinga does not provide investment advice. All rights reserved.
Trade confidently with insights and alerts from analyst ratings, free reports and breaking news that affects the stocks you care about.