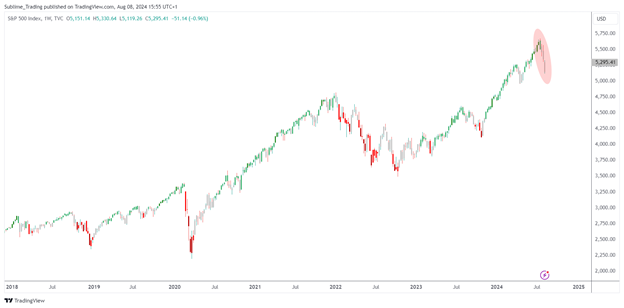
- Although there have been substantial rebounds in major indices, the markets haven't fully recovered to their previous highs.
- Despite this year's market fluctuations, the S&P 500 shows signs of growth, with an 11% increase year-to-date.
In recent trading sessions, global stock markets have faced a lot of ups and downs, with significant drops followed by quick recoveries. A key example is Japan’s Nikkei 225, which experienced its biggest drop since 1987 but then rebounded by nearly 11%.
In the United States, the S&P 500 SPY index also showed resilience. After a 3% decline on Monday due to a worldwide sell-off and rising economic worries, it bounced back with a 1.36% increase.
The market's decline was due to several factors. Disappointing job market data from the U.S. played a significant role, along with the Federal Reserve's position on interest rates. Additionally, a major shift in the yen carry trade contributed to the chaos.
The Bank of Japan's decision to raise interest rates strengthened the yen, disrupting the typical practice of borrowing yen to invest in higher-yielding assets worldwide.
Despite these recoveries, it's important to note that the markets have not fully regained the losses from their previous lows. This partial recovery indicates that while investor confidence is returning, it remains shaky amid ongoing economic uncertainties.
The technology sector, particularly high-performing companies like Nvidia, Apple, and Google, continues to be a major concern. The stock movements of these tech giants significantly impact market indices due to their high valuations and substantial market weight, making their performance closely watched as a signal of overall market health and investor sentiment.
When we look at the bigger picture, the S&P 500's performance this year adds depth to the market story. It reached an all-time high in mid-July but then dropped by 8.32%, showing the increased volatility in today's economic environment.

However, the index has gained 11% year-to-date, indicating growth potential despite these ups and downs. In August, it fell by 4% but then recovered by 3%, hinting at possible continued bullish momentum if the trends persist.
If the market can maintain this momentum and break above previous highs, it could signal a continuation of the long-term bull trend.
After the closing bell on Wednesday, August 7, the index closed at $5199.51, trading down by 0.88%.
This article is from an unpaid external contributor. It does not represent Benzinga's reporting and has not been edited for content or accuracy.
Edge Rankings
Price Trend
© 2025 Benzinga.com. Benzinga does not provide investment advice. All rights reserved.
Trade confidently with insights and alerts from analyst ratings, free reports and breaking news that affects the stocks you care about.