Below are five stocks to watch according to VantagePoint, a platform that uses artificial intelligence and intermarket analysis to predict price movement.
What's On The Charts
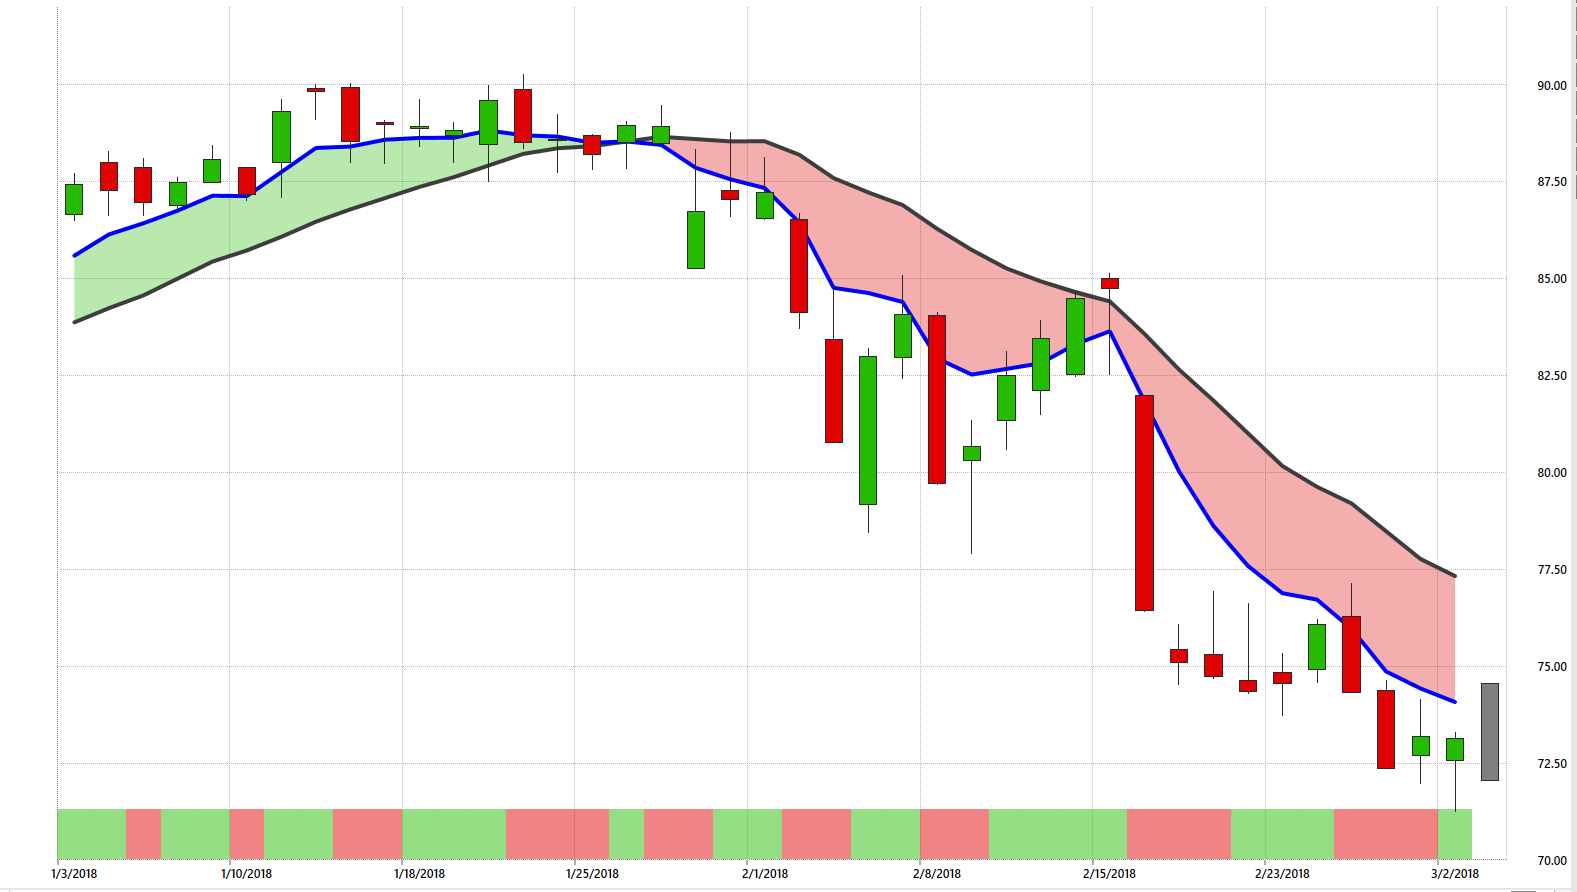
- Each candle on the following stock charts represents one day of trading action.
- The black line on the chart is a simple 10-day moving average.
- The blue line is generated via the AI in VantagePoint's intermarket analysis. It forecasts what the moving average will be 48 hours in advance.
- As you can probably tell, shaded areas of the candle chart represent whether the stock is in an uptrend or downtrend.
A trend shift is represented by the two lines crossing. As long as the two lines don't cross, the current trend remains intact.
- The red/green bar below the candle chart is a Neural Index. It determines whether a stock will move higher or lower in the coming two days.
This Week's Hot Stocks
Scripps Networks Interactive
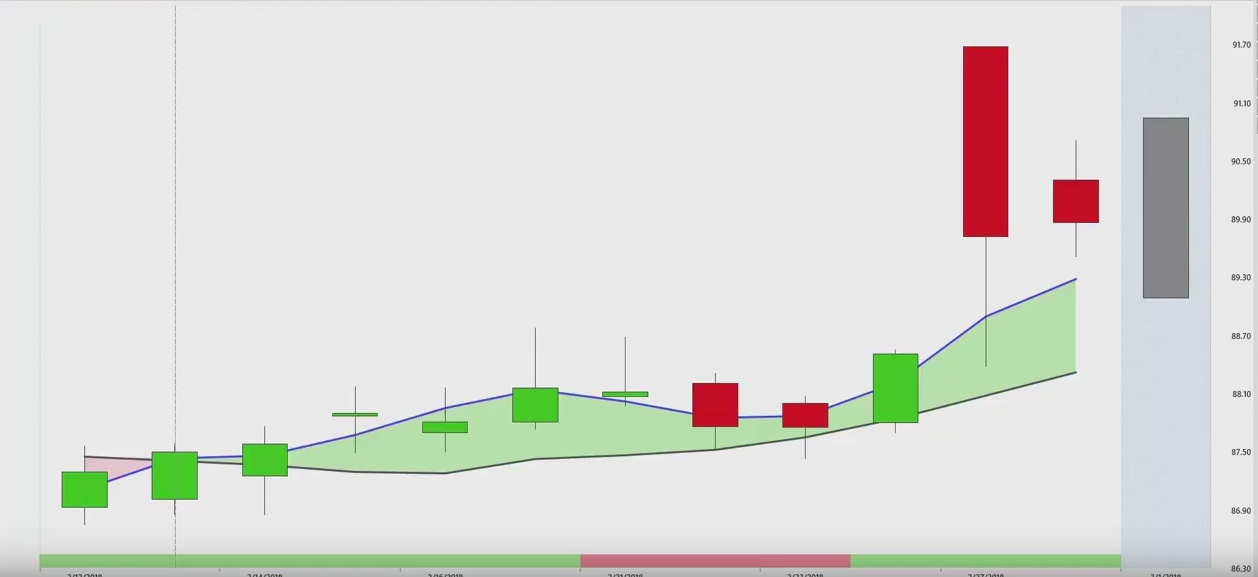
Scripps Networks Interactive, Inc. SNI had a predictive moving average crossover to the upside two weeks ago, thereby indicating a bullish trend. The chart above shows the stock since mid-February, with every candle representing one day of trading. The gap up on Feb. 27 happened in premarket trading, as the U.S. DOJ cleared the way for Discovery Communications DISCA to acquire the company. Following that news, the stock popped 3.5 percent to an all-time high.
United Parcel Service
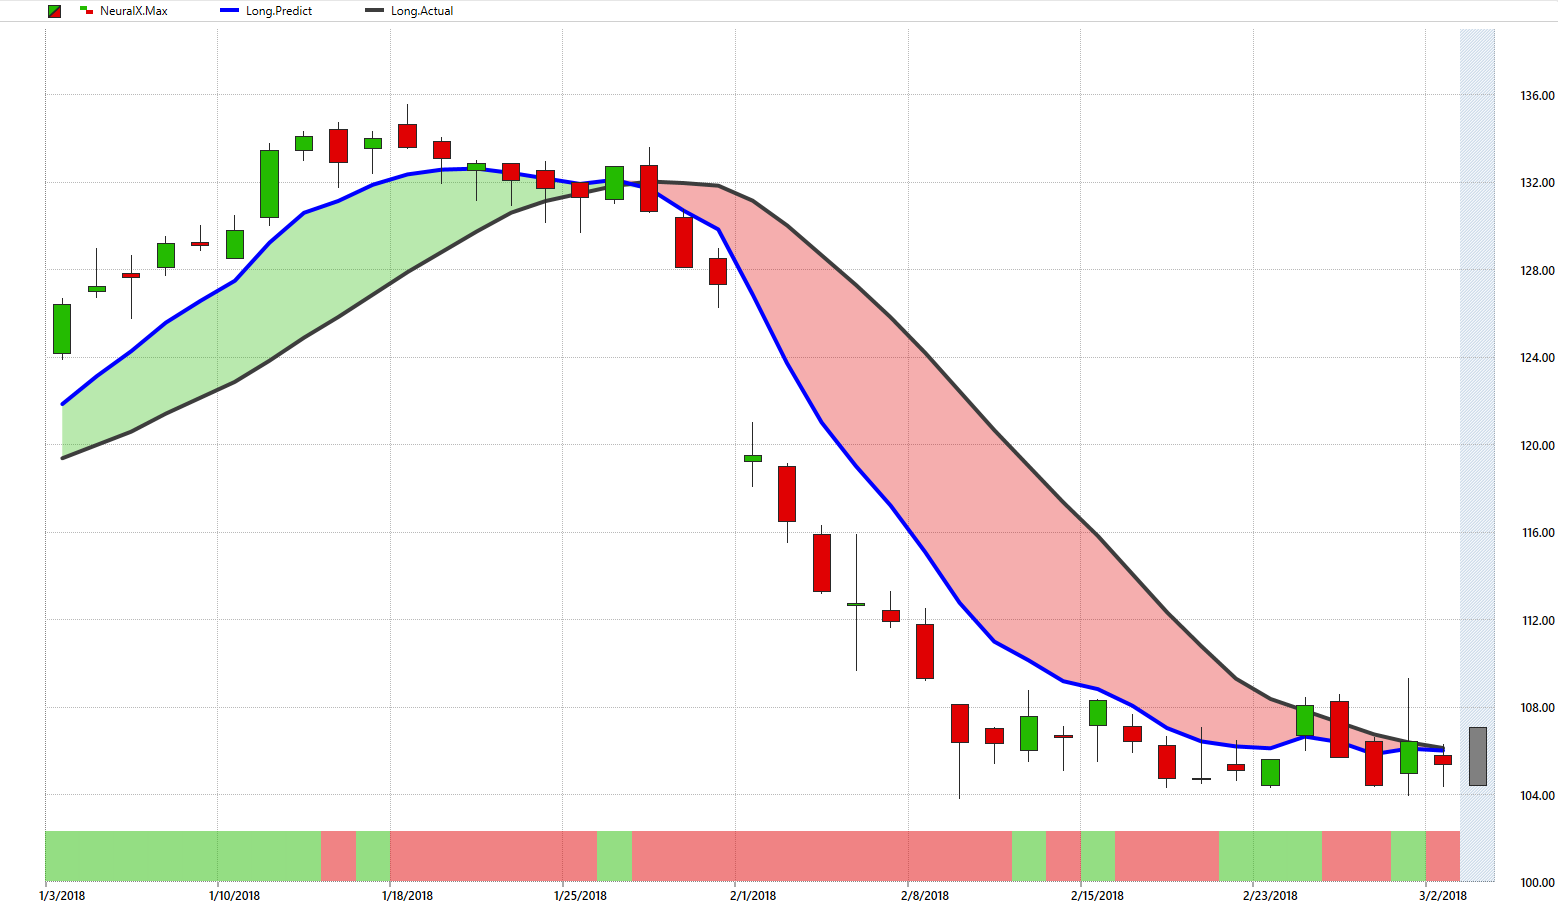
United Parcel Service, Inc. UPS had a crossover to the downside at the end of January, indicating that the stock is in a downtrend. This was confirmed by the Neural Index turning to red. The crossover, as shown by the black 10-day moving average line crossing above the predicted moving average, was followed two days later by the company's Q4 earnings report, which did not impress Wall Street. Since the report the stock is down over 17 percent, but you can see how the trend has weakened as the stock has entered a period of consolidation.
BorgWarner
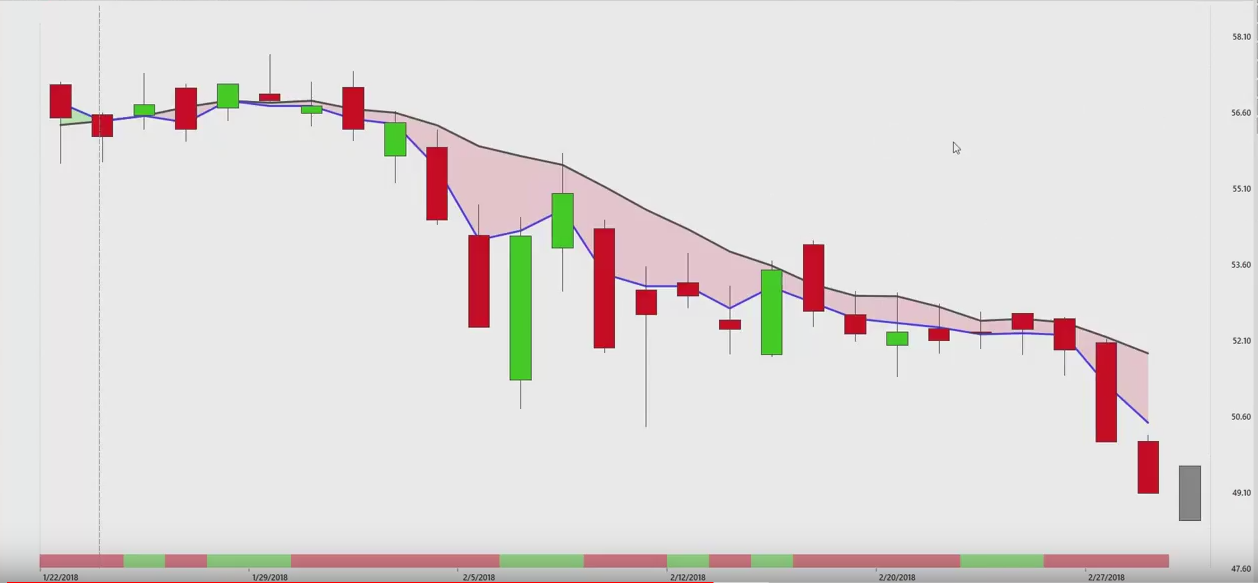
BorgWarner Inc. BWA follows the same general principle. It had a bearish crossover in late-January following the company's announcement of revised fiscal year and Q1 guidance. Though the stock is off to a strong March, the VantagePoint indicators on the chart are tell us the stock is in for further downside.
Delphi Automotive
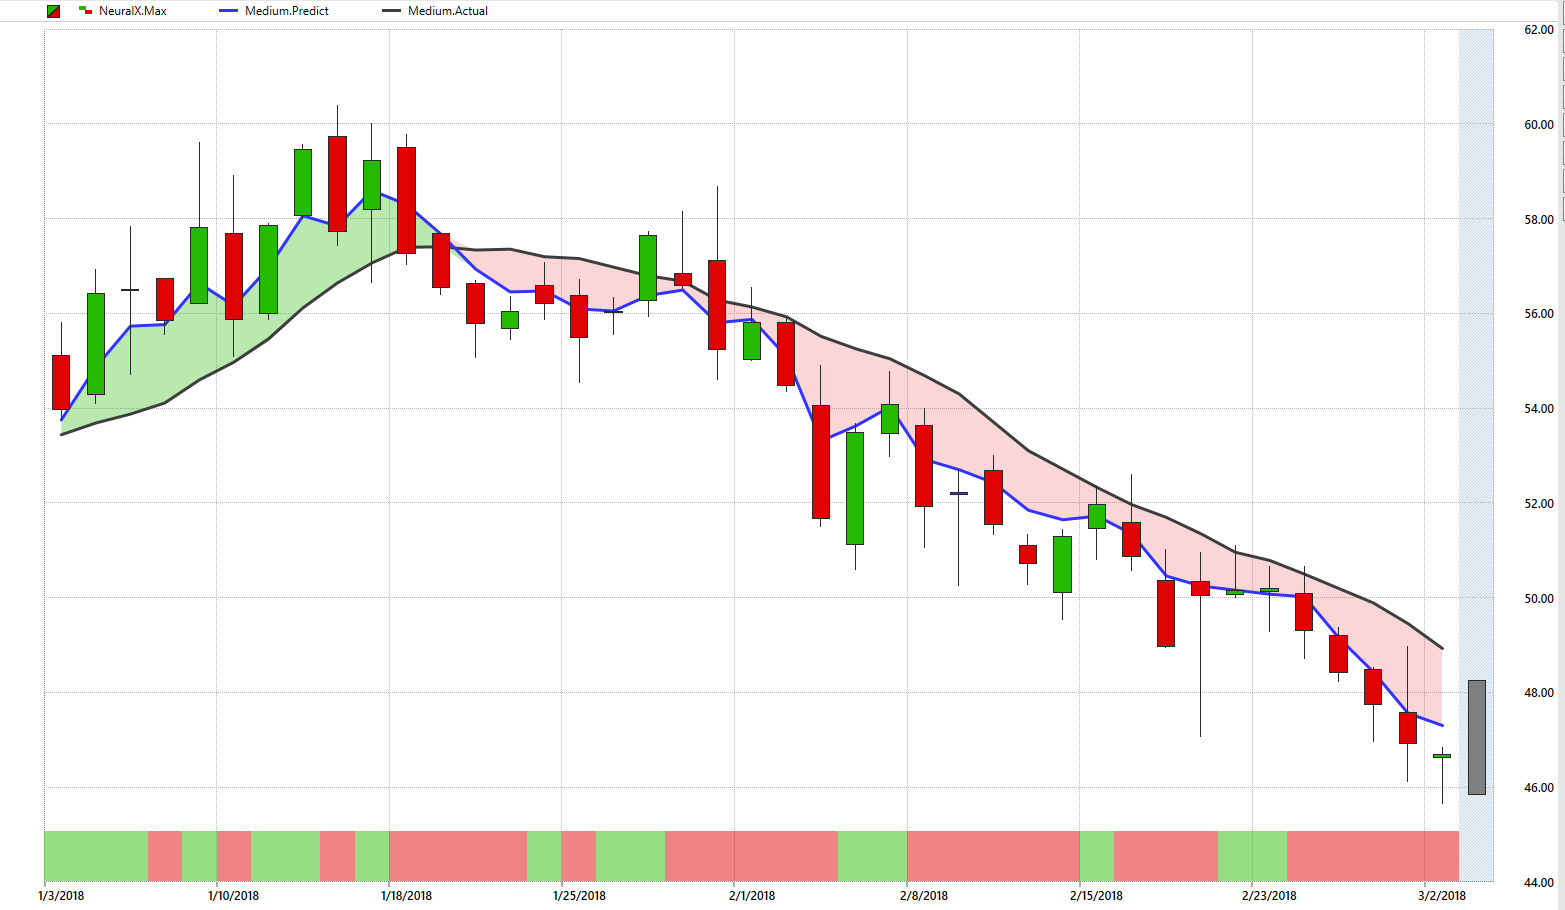
Delphi Technologies PLC DLPH has found itself in a considerable downtrend after making all-time highs in January. Despite that, the stock is still up 21 percent from its IPO price on Nov. 21. But traders shouldn't let that fool them. The stock is down 23 percent from its highs, and all the VantagePoint indicators show that the current trend will not change anytime soon.
Ryder System
Ryder System, Inc. R had a bearish crossover along with the rest of the market in late-January. But unlike the S&P 500, Ryder has not recovered. Since the start of February, the stock is down over 16 percent. VantagePoint's predicted price action, the gray candle on the right end of the chart, predicts likely further downside on Tuesday.
Watch the full Hot Stocks Outlook below
About the Hot Stocks Outlook
The Hot Stocks Outlook is a weekly series. It’s designed to show traders how improving their timing is the key to maximizing gains and minimizing losses. VantagePoint Trading Software identifies trend reversals with up to 86 percent accuracy, helping traders get into the right side of trades at just the right time.
VantagePoint is an editorial partner of Benzinga. For a free demo click here.
© 2024 Benzinga.com. Benzinga does not provide investment advice. All rights reserved.
Comments
Trade confidently with insights and alerts from analyst ratings, free reports and breaking news that affects the stocks you care about.

