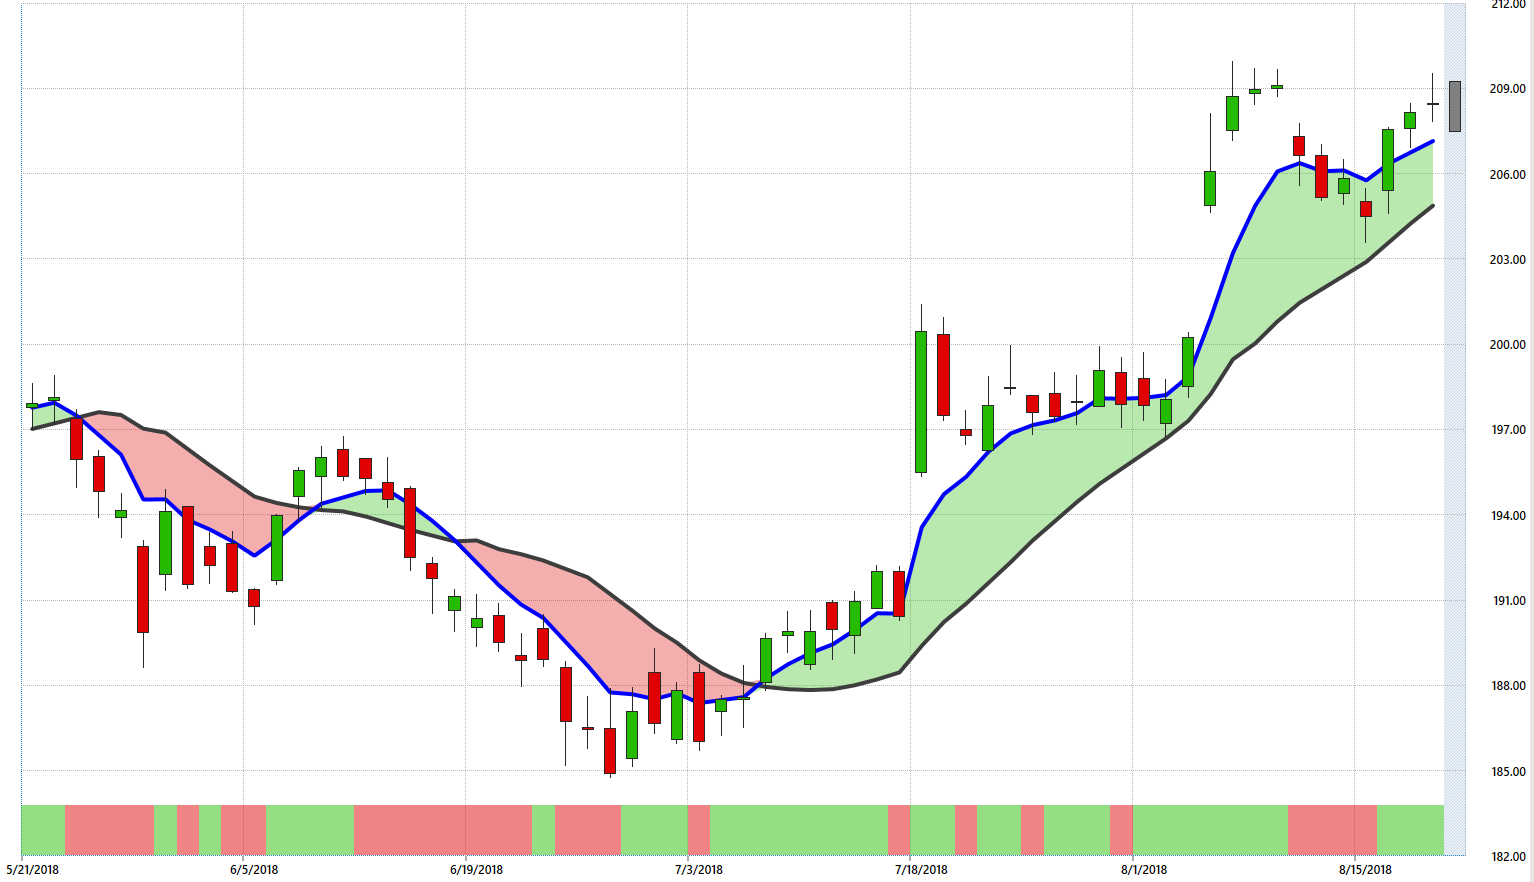
The following four stocks are currently in the midst of strong trends according to VantagePoint, an AI charting platform that uses intermarket analysis and artificial intelligence to predict future price action 1-3 days in advance.
A couple of things to know in order to understand the charts below:
- Each chart is a 3-month chart. Candles represent one day of trading
- The blue line is a predicted moving average, and the black line is a simple 10-day moving average
- When the blue line crosses above the black, that's a bullish signal. When the black crosses over the blue, that's bearish
For a more detailed look at VantagePoint's charts, click here.
Bullish Stocks
1. Ball Corporation
Ball Corporation BLL is up 18 percent since making a low on July 28. VantagePoint's indicators show the stock crossed over into a bullish uptrend not long after that, and despite five down days from August 8-14, the two moving averages never crossed back over. With the stock rebounding over the last week, and the neural index at the bottom of the chart forecasting near-term strength, this one looks like it should keep going higher for now.

2. Berkshire Hathaway
Berkshire Hathaway Inc. Class B (NYSE: BRK-B) had a bullish crossover according to VantagePoint on July 9. Since then, the stock is up over 11 percent and is the highest it's been since mid-March. The distance between the predicted moving average and simple moving average, coupled with the neural index's recent shift to green, tell us that this uptrend is strong.

Bearish Stocks
1. Activision Blizzard
Activision Blizzard, Inc. ATVI has been in a steady dowtrend for the last four weeks. During that time, shares of ATVI have dropped over 14 percent, giving back nearly all of the gains from May-July. VantagePoint's two strongest indicators lead us to one conclusion: this trend is not slowing down. Between the divergence of the moving averages, red neural index, and gray candle predicting further downside, we can expect further downside in ATVI for the time being.

2. Scientific Games
Scientific Games Corp SGMS had its last bearish crossover on July 24, and the stock has since lost a third of its value, going from $45 a share to $30. Looking a little longer term, SGMS is actually down 50 percent since June 7. While the neural index's recent shift to green hints that maybe the stock has found technical support, the wideness of the gap between the predicted and 10-day moving averages tells us that we'll need a few more days of holding up to signal that this downtrend is over.

VantagePoint is a content partner of Benzinga. For a free demo, click here. `
© 2025 Benzinga.com. Benzinga does not provide investment advice. All rights reserved.
Trade confidently with insights and alerts from analyst ratings, free reports and breaking news that affects the stocks you care about.