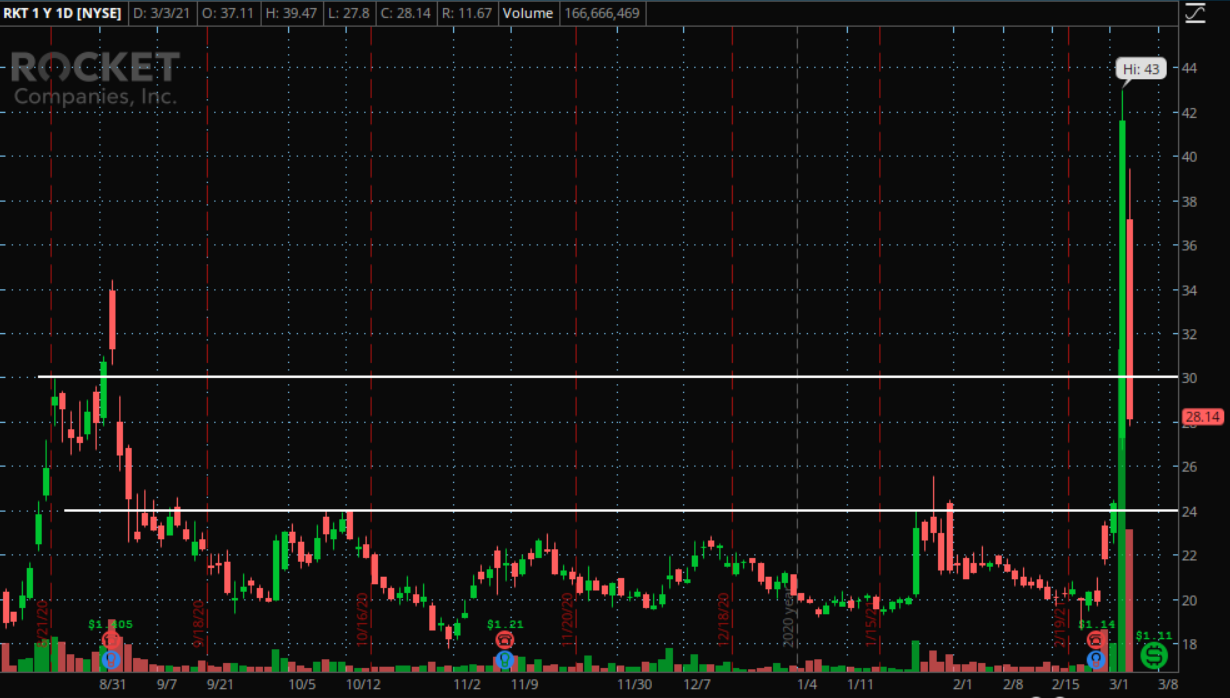
Rocket Companies RKT stock is on a wild ride this week, mounting a rally in Tuesday's session and a decline in Wednesday's fueled by WallStreetBets traders.
Rocket's High Short Float: Rocket was primed to have a short squeeze if buying pressure appeared in the stock with substantial volume, as the shares had a short float percentage of over 38%.
Enough volume occurred in Tuesday’s trading session to move the price from a low of $26.75 to a high of $43.
Rocket shares closed Wednesday's session down 32.99% at $28.01.
Related Link: What's Driving The Rally In Rocket Competitor UWM Holdings?
Rocket Technical Levels: Speculative key levels on the chart can make it easier to find places to buy and sell without chasing into a large spike. Let's check out some of the technicals below.
One thing technical traders look at when they are speculating where to buy and where to sell is previous chart history. Previous chart history can help technical traders find what they may speculate are support and resistance levels.
These price levels are found by looking at the daily chart to see where the price has struggled to move above or below. After the price breaks through possible psychological barriers, those barriers can switch from support to resistance or vice versa.

The daily chart history on Rocket above shows that the price was unable to surpass $30 and hold above that level on multiple occasions.
With the recent rally, the price did surpass $30, so a technical trader could now speculate that Rocket's price could bounce here as a support line.
Nothing is certain in the market, and the price breaking and holding below this level could plausibly bring about a further sell-off.
The price of $24 is another level where the price has previously been unable to break throughout the past year in multiple instances.
This is another price level a technical trader may view as a support if the $30 level is unable to hold.
On the bullish side, a bounce on one of the support levels is what a technical trader would look for. The bearish technical trader would ideally look for the support level to break and hold below for an additional downward move in price.
Edge Rankings
Price Trend
© 2025 Benzinga.com. Benzinga does not provide investment advice. All rights reserved.
Trade confidently with insights and alerts from analyst ratings, free reports and breaking news that affects the stocks you care about.