


BlackBerry Ltd. BB, a WallStreetBets favorite, closed Tuesday up 7% at $10.45.
Some Technical Levels to Watch
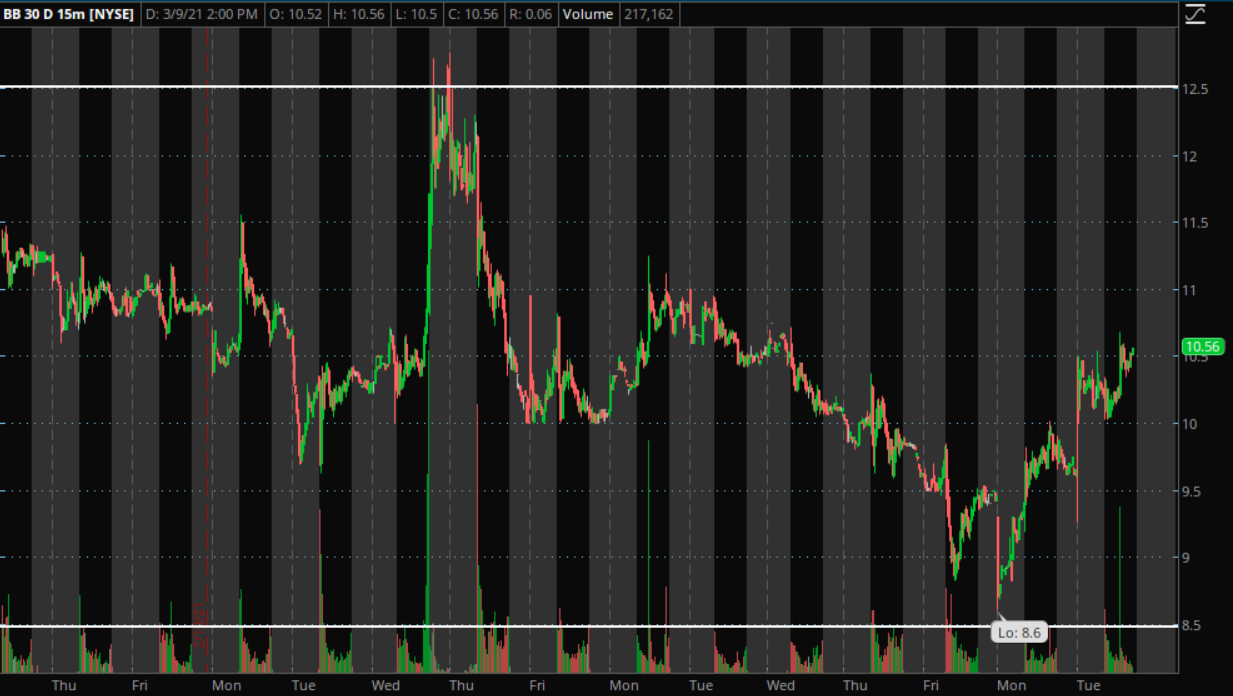
The short-term 15-minute chart above shows that the stock is trading in a channel between the range of $8.50 and $12.50. The chart also shows the stock has been hovering around the $10.50 level for the past 15 days.
The short-term chart history shows the stock was unable to break below the $1.50 level or break above the $12.50 for an extended period of time.

The daily chart above shows the stock was previously trading above the $12 mark holding as a support level before falling through the level. After the stock showed this level was a place of resistance where it could not get above. The stock fell further to near $9 where it found some support. Now the stock seems to be trending in a channel between the two price levels.
A bullish technical trader may like to see a price movement break above a resistance level with a period of consolidation before a further price increase may have the potential to happen.
See also: How to Buy BlackBerry (BB) Stock
A bearish technical trader would like to see the price fall through the support level with some consolidation below before a further move down may be possible.
BlackBerry has a market cap of $5.73 billion and a public float of 555 million shares.
Edge Rankings
Price Trend
© 2025 Benzinga.com. Benzinga does not provide investment advice. All rights reserved.
Trade confidently with insights and alerts from analyst ratings, free reports and breaking news that affects the stocks you care about.

