Sigma Labs Inc. SGLB shares caught fire in Monday's session following the company's announcement of a contract award from Lockheed Martin Corporation LMT's Space Additive Design & Manufacturing Center.
The stock was trading 150.9% higher at $8.38 at last check. 
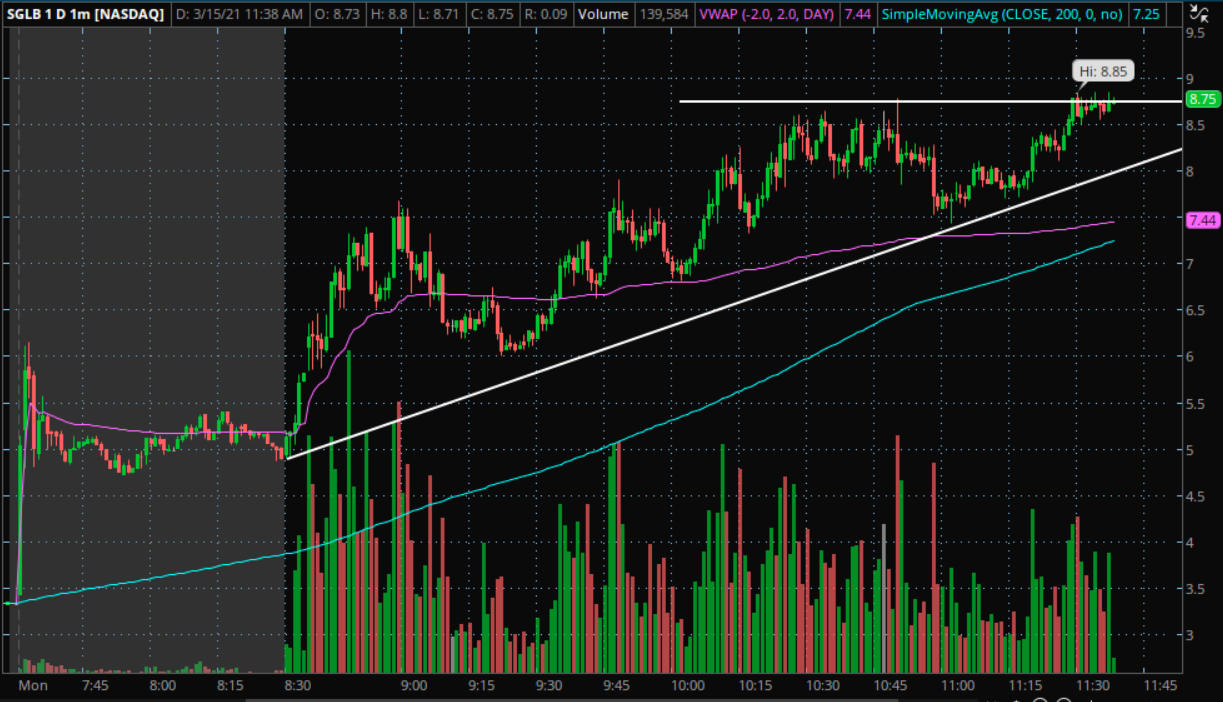
Sigma Labs Technical Levels To Watch: The 1-minute chart above shows the stock has been in an uptrend all day.
This occurs when there is a positive slope of the line connecting all of the lows on the chart. A potential resistance level can be found near the $8.75 mark, as this was the peak on many 1-minute candles.
Bulls would like to see the stock maintain higher lows and stay above the VWAP (pink) and 200-day moving average (blue), maintaining a bullish outlook on the stock for the day.
A cross above the resistance line could bring about the next move up. If this were to happen, look for the price to retest near this level for a bounce.
Bears would like to see the stock stop forming higher lows on the day. A cross below both the VWAP and 200-day moving average would also be ideal. A cross below these levels may bring about a quick strong bearish move to the stock.
Long-term technical levels are a guessing game for stocks that more than double on the day. A long-term trader bullish trader may like to enter on a day where the stock makes a correction. Buying stocks on a day when they run 100% comes with many risks for a technical trader.
Sigma labs is trading with a market cap of $25 million and a public float of 5.6 million shares.
Benzinga’s “Get Technical” is all about engagement. Ask for the stock analysis that you want to see! Learn about indicators such as MACD, Fibonacci retracement, RSI and moving averages. Watch today’s show in the video below:
© 2025 Benzinga.com. Benzinga does not provide investment advice. All rights reserved.
Trade confidently with insights and alerts from analyst ratings, free reports and breaking news that affects the stocks you care about.