


Penn National Gaming Inc. PENN shares pulled back Monday, and the chart has been trending down over the last week.
The closed down 7.85% at $98.21.
Here's a look at the technical levels for Penn National stock.

Penn National Short-Term Chart Analysis: The 5-minute chart above shows the stock has been in a downtrend throughout the week, seen by connecting the highs with a line.
The stock looks to be nearing support that will be shown further in the daily chart below.
In the short term, bears would like to see the stock continue to hold below this line and fall below support in what a technical trader may call a “descending triangle” pattern. Bulls would like to see the stock break above the line for a potential change in trend.
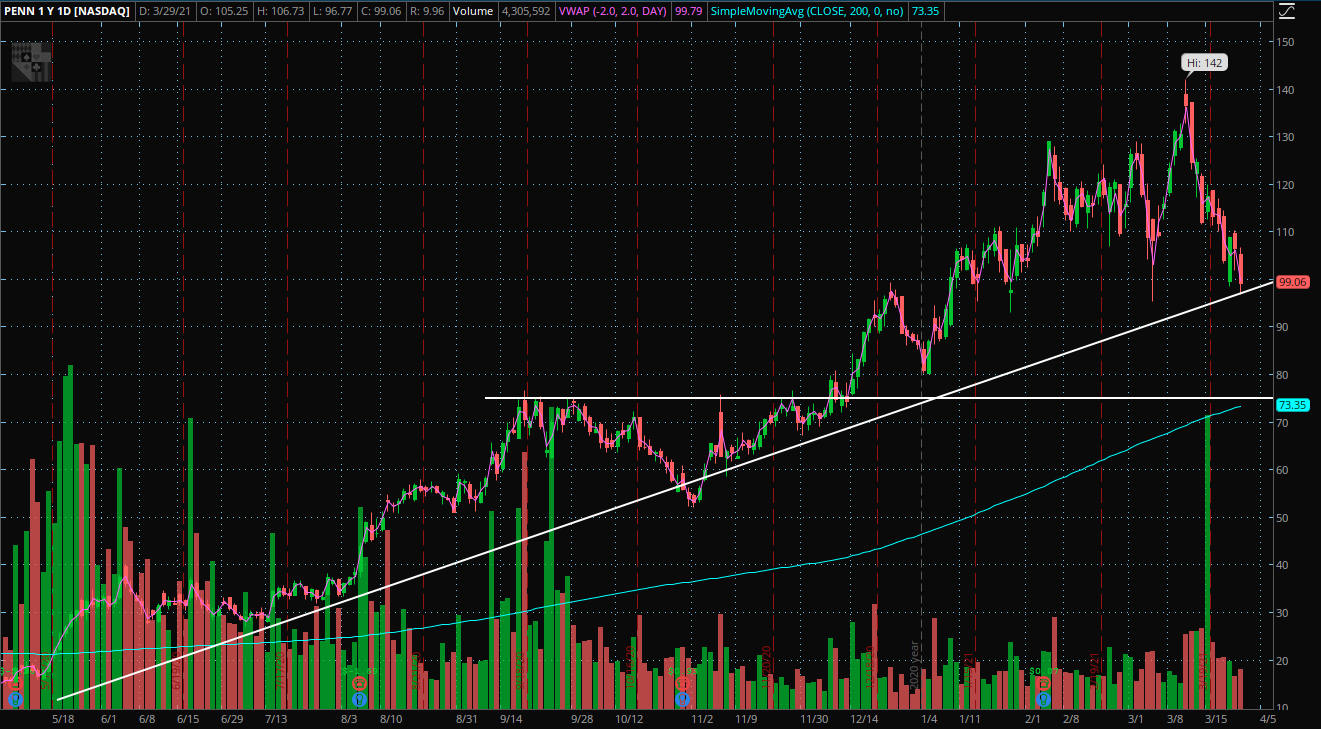
Penn National Gaming Daily Chart Analysis: The daily chart above shows the stock has been in an uptrend throughout the last year.
The stock looks to be approaching a potential support level made by connecting the lows of the chart. This line is a place the chart has been able to hold above multiple times in the past and may hold again in the future.
Bullish traders would like to see the stock bounce off the support level and continue to build higher lows.
Bears would like to see the stock fall through the line. Further support may not be found until the stock nears the $75 level.
The stock is trading above the 200-day moving average, indicating the stock has bullish sentiment for the year. This indicator sits near the $75 level, further adding to the potential support near this area.
Edge Rankings
Price Trend
© 2025 Benzinga.com. Benzinga does not provide investment advice. All rights reserved.
Trade confidently with insights and alerts from analyst ratings, free reports and breaking news that affects the stocks you care about.

