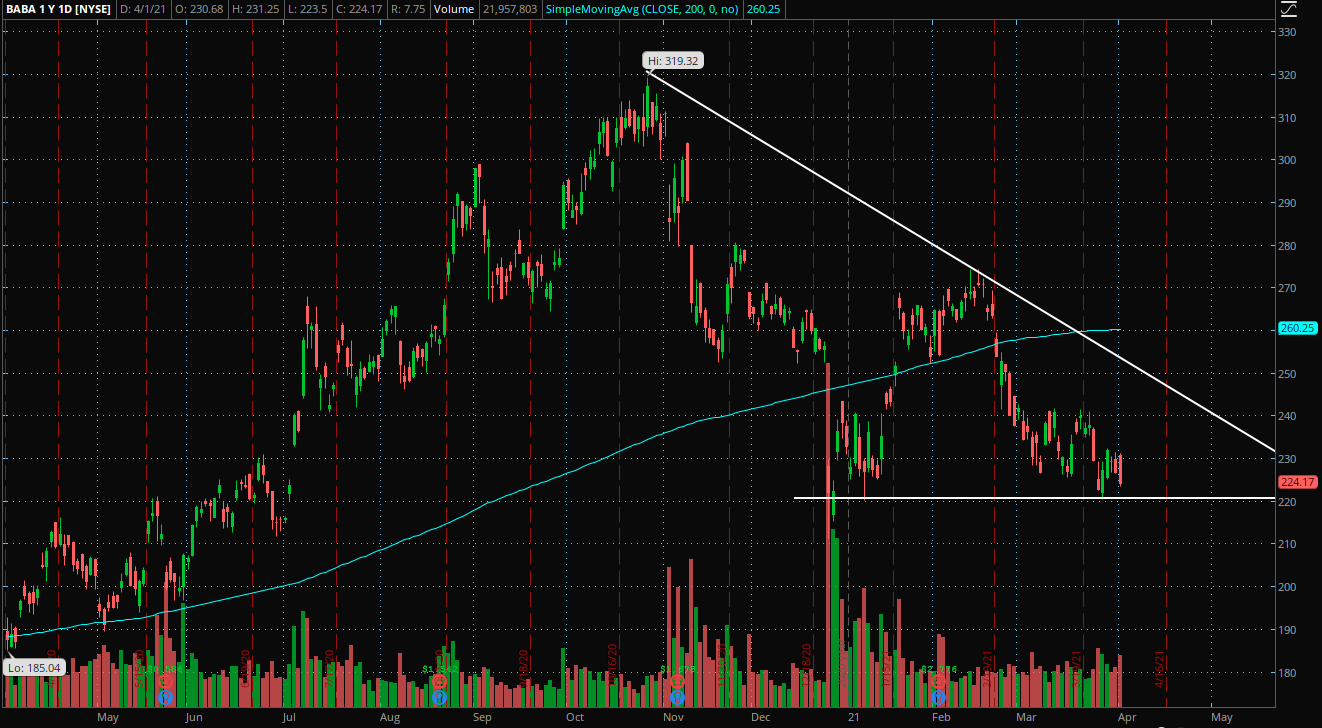
Alibaba Group Holding Ltd. BABA shares were trending Thursday. The stock looks to be nearing the support level and looking to test it soon. Below is a technical analysis on the chart.
Alibaba closed down 1.05% at $224.36.

Alibaba Daily Chart Analysis: Alibaba looks to be forming what technical traders may call a “descending triangle” pattern.
Connecting the highs of the chart together with a line shows that the highs are getting lower observable by the negative slope of the line.
These highs are condensing the price between a flat bottom near $220. The stock has found support near the $220 level multiple times in the past and may again in the future.
The stock is trading below the 200-day moving average (blue), possibly indicating sentiment in the stock is bearish. This indicator may hold as a resistance level sometime in the future.
What’s Next: Bullish technical traders would like to see the stock bounce near the $220 level. Following a bounce, bullish traders would like to see the stock cross above the line that connects the highs.
If the stock were to be able to cross above the line that connects the highs, it may indicate the trend is changing from bearish to bullish.
See also: How To Buy Alibaba Stock
Bearish traders would like to continue to see the stock hover near the $220 area. If the stock is able to fall below this level and have a period of consolidation, it may see a stronger push downwards in the future.
The stock pushing below the $220 support level may confirm the bearish descending triangle pattern. Although the term bearish is in the name of the pattern, it may not act accordingly.
Edge Rankings
Price Trend
© 2025 Benzinga.com. Benzinga does not provide investment advice. All rights reserved.
Trade confidently with insights and alerts from analyst ratings, free reports and breaking news that affects the stocks you care about.