

The charts of Amazon.com, Inc. (NASDAQ,AMZN), Netflix, Inc. NFLX, Facebook, Inc. FB, and Golden Star Resources Ltd. GSS can teach valuable lessons about the market.
What To Know: Technical analysis has a bad reputation. This isn’t surprising. Many technical analysts don’t understand the fundamentals. Even worse, some are advocates of bizarre methods like Gann analysis and harmonic charts.
These things are like Bigfoot: They may be fun to talk about, but they aren’t real!
What is real, however, is that in financial markets certain price levels are more important than others. If applied correctly, technical analysis is an illustration of these dynamics.
See Also: What Is Tax Lot Allocation And Why Could Retail Traders Be 'Making A Very Expensive Mistake'?
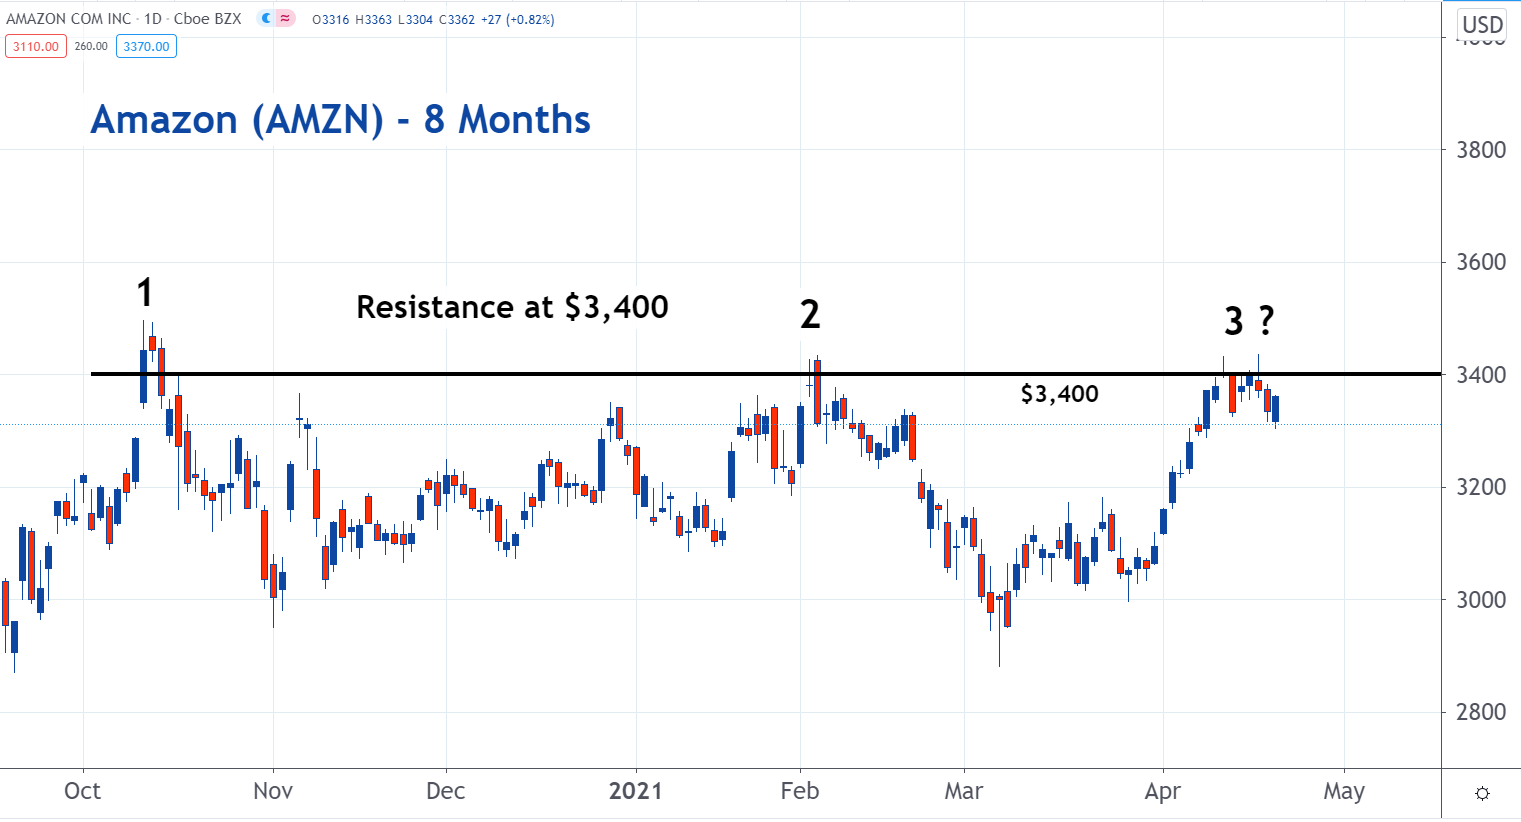
Why It's Important: The $3,400 level has been resistance for Amazon.
Resistance is a large concentration of sellers who are trying to get the same price for their shares. At resistance levels, there is more supply for the stock than there is demand. Rallies end when they reach these levels.
Amazon shares trended lower after hitting this resistance in October and early February. Shares have reached this level again and may begin to trend lower.
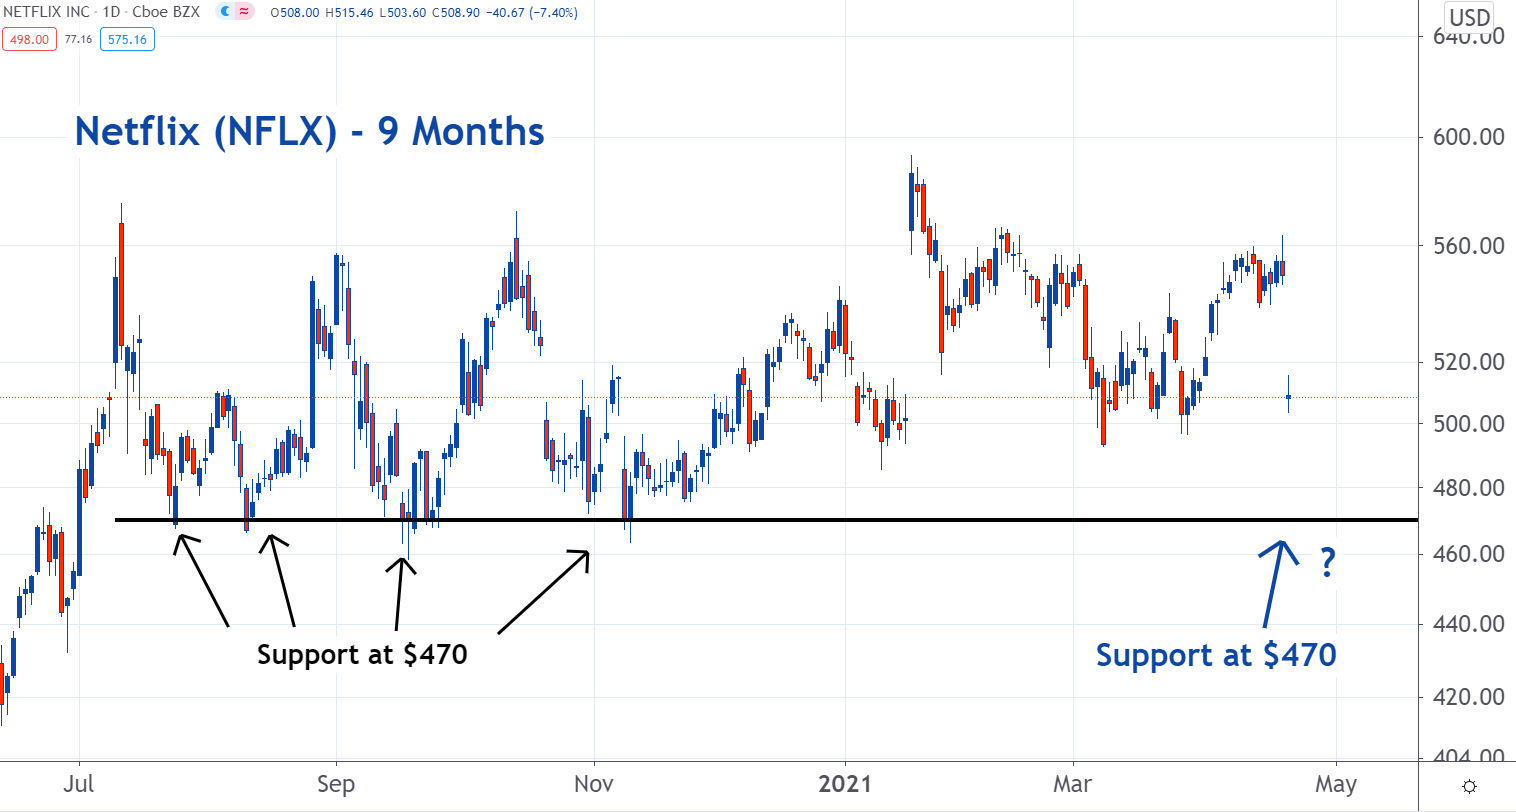
The $470 level is support for Netflix.
Support is the opposite of resistance. It's a large concentration of buyers who are trying to pay the same price for their shares. At support levels, there is more demand for the stock than there is supply. Selloffs end when they reach these levels.
As you can see on the following chart, each time last year Netflix shares fell to $470 a rally followed. If they drop back to this level, it could happen again.
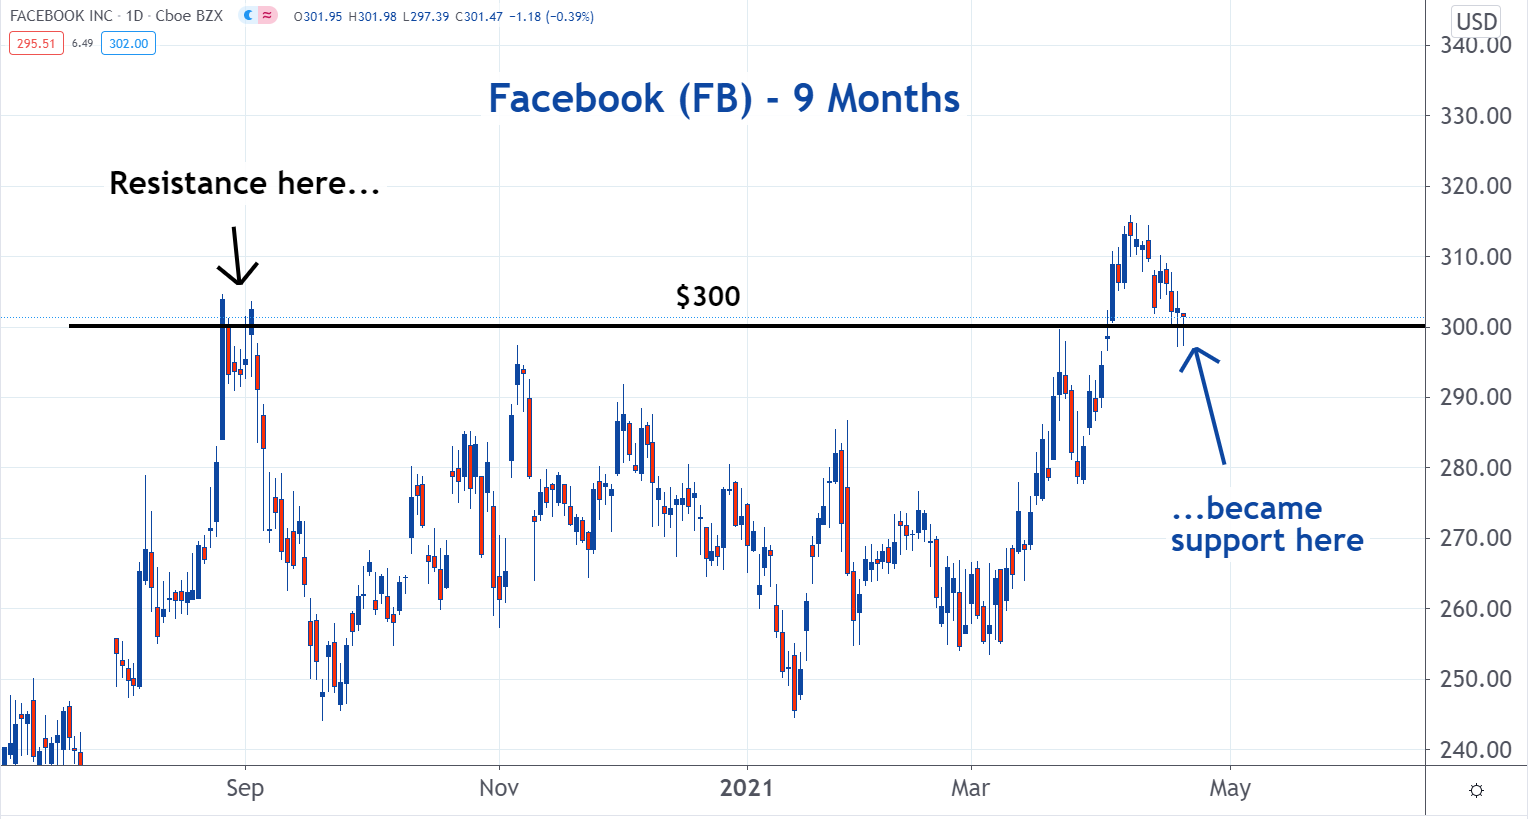
The chart of Facebook shows how levels that had been resistance can turn into support levels. This happens because many investors who sold their shares at $300 last August thought they made a good decision when the stock traded lower. Now shares have rallied and are trading above this price.
Many of these investors now think they made a mistake. A number of them decide to buy the stock back, but they will only do so if they can get it for the same price they sold at.
As a result, buy orders are placed at a level that had previously been resistance, which will form support. If there are enough of these buy orders, the level will turn into a support level.
That is the case here with the $300 level for Facebook.
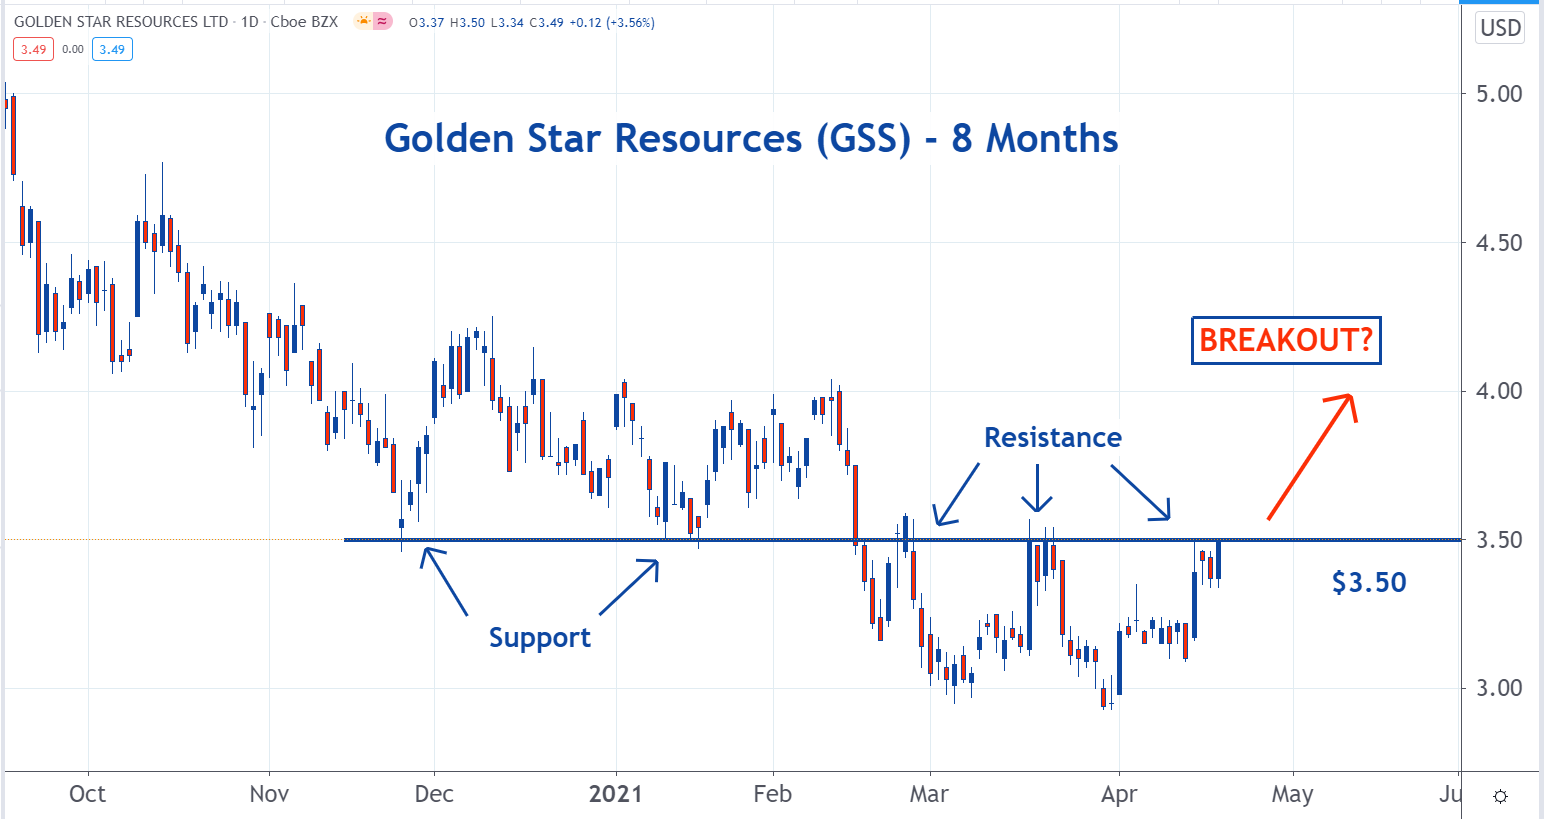
Golden Resources illustrates the opposite dynamic. It shows how a level that had been support can turn into a resistance level.
Resistance has formed at this level because it was support from late November through early February. Investors who bought the stock at that time regret buying it because, with the stock lower, they're losing money. Many of them decide to sell, but they're reluctant to take a loss.
So they decide to sell the stock if it rallies back up to their buying price. As a result, sell orders are placed at the level that had been support. If there are enough of these orders, the level will convert into resistance.
This happened with Golden Resources and the $3.50 level.
© 2025 Benzinga.com. Benzinga does not provide investment advice. All rights reserved.
Trade confidently with insights and alerts from analyst ratings, free reports and breaking news that affects the stocks you care about.

