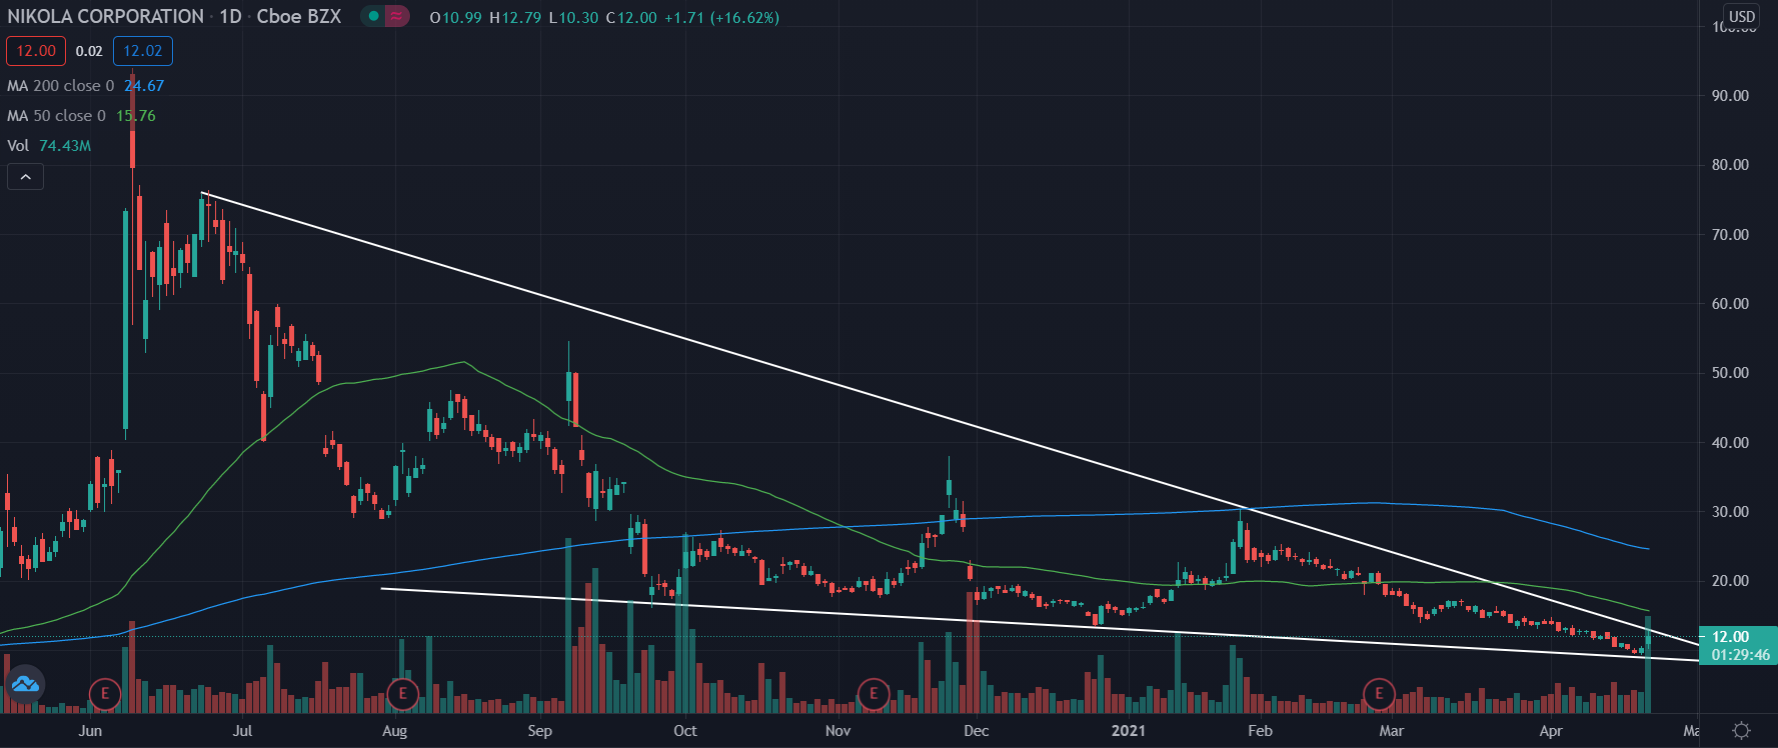
Nikola Corp. NKLA traded sharply higher Thursday after the company announced it would collaborate with TravelCenters Of America, installing fuel stations at existing TA-Petrol sites.

Nikola Daily Chart Analysis
- The stock is trading below both the 50-day moving average (green) as well as the 200-day moving average (blue). This indicates the stock has had bearish sentiment throughout the recent months.
- The moving averages are areas on the chart that may hold as resistance levels unless the price makes a strong move upwards past them.
Key Levels To Watch
- The stock has been falling the past couple of months, forming into what technical traders may call a falling wedge pattern.
- This pattern is considered a bullish reversal pattern as connecting the highs shows a much steeper drop compared to connecting the lows of the chart, forming a wedge.
- A break above the line connecting the highs may signal the stock is changing trends and ready to start heading back up.
- A break below the line connecting the lows could bring about a stronger downward push.
What’s Next?
Bullish technical traders would like to see the stock break out of the falling wedge pattern and start moving upwards. To confirm the breakout of the wedge pattern, traders would like to see the stock cross above the line connecting the highs with some consolidation.
Bearish technical traders would like to see the stock break out of the pattern to the downside. A cross below the line connected by the lows may bring about a large drop-off.
© 2025 Benzinga.com. Benzinga does not provide investment advice. All rights reserved.
Trade confidently with insights and alerts from analyst ratings, free reports and breaking news that affects the stocks you care about.