Twitter Inc. TWTR shares were slammed Friday after the social media company issued second-quarter sales guidance with a midpoint below analyst estimates. Several analyst ratings were adjusted after the sales guidance was issued.
Twitter is guiding for second-quarter revenue to come in a range of $980 million to $1.08 billion. The consensus is for revenue to hit $1.06 billion in the second quarter.

Twitter Daily Chart Analysis
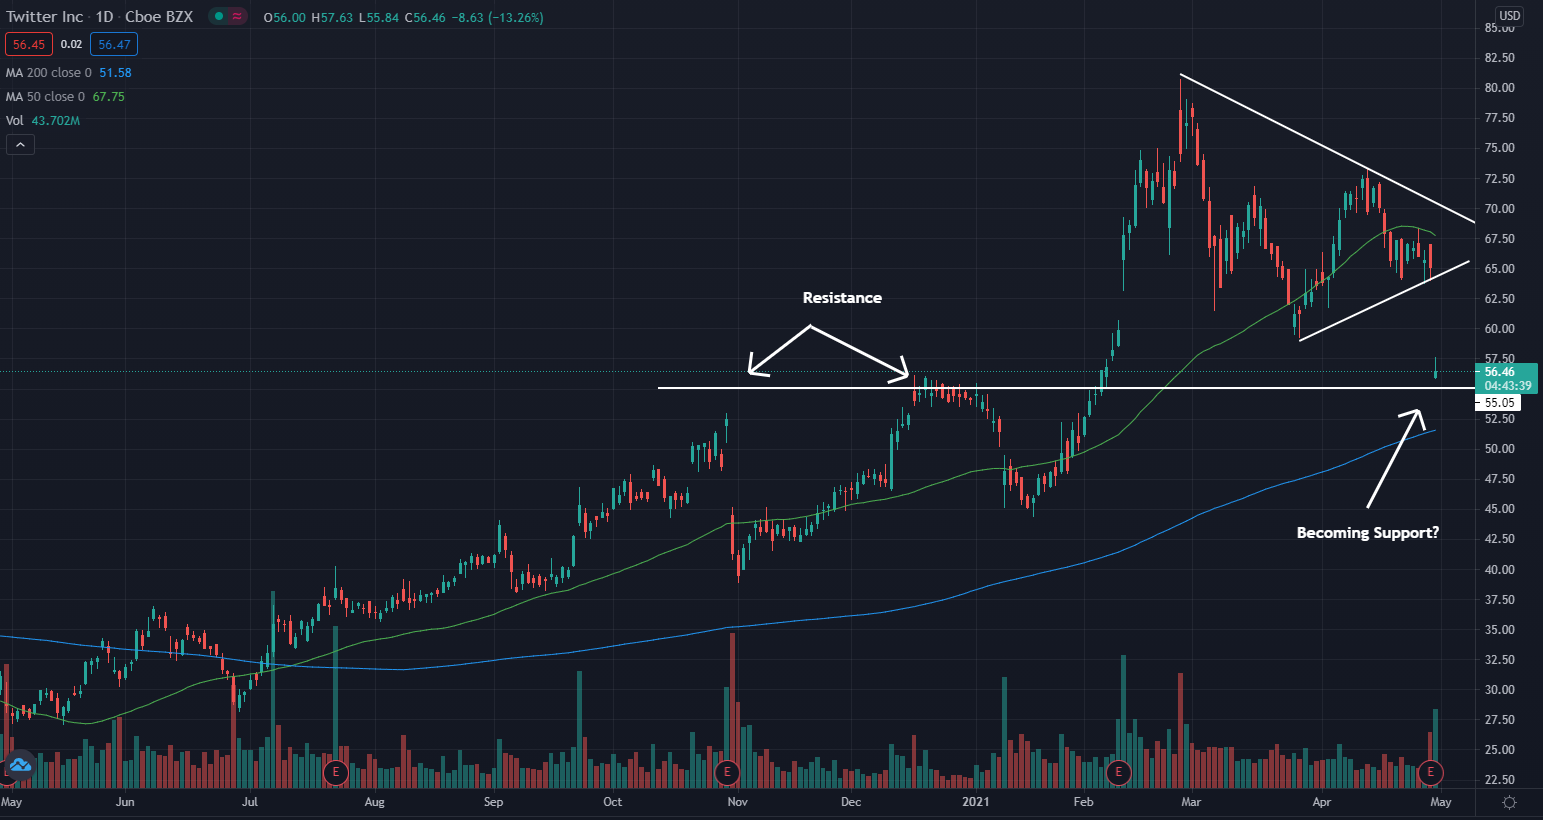
- Twitter is nearing a potential area of support that previously held up as resistance.
- The stock is trading below the 50-day moving average (green), but above the 200-day moving average (blue), indicating the stock is most likely facing a period of consolidation.
- The 50-day moving average may hold as a place of resistance on the chart and the 200-day moving average is a potential area of support.
Key Levels To Watch
- The stock looks to be nearing a potential area of support near the $55 mark.
- The $55 level previously held as resistance as the stock struggled to get above this level for a period of time.
- The stock looked like it was forming into a pennant pattern before Friday, but with the recent news, the stock broke out of the pattern to the downside.
What’s Next?
Bullish technical traders would like to see the stock be able to hold the $55 level as support and start heading higher.
Bearish technical traders would like to see the stock fail to hold the $55 level as support. A break below the potential $55 support, and the 200-day moving average, could bring about a change in overall trend and bring bearish sentiment to the stock.
Twitter is a top 10 holding in the following ETFs: Communication SErvices Select Sector Fund XLC, Invesco Dynamic Media ETF PBS.
Edge Rankings
Price Trend
© 2025 Benzinga.com. Benzinga does not provide investment advice. All rights reserved.
Trade confidently with insights and alerts from analyst ratings, free reports and breaking news that affects the stocks you care about.