Ford Motor Co. F shares are trading higher after the company announced plans to beef up its electric vehicle development.
Ford shares gained 7.13% Thursday, closing at $14.88.
Below is a technical analysis of the chart.

Ford Daily Chart Analysis
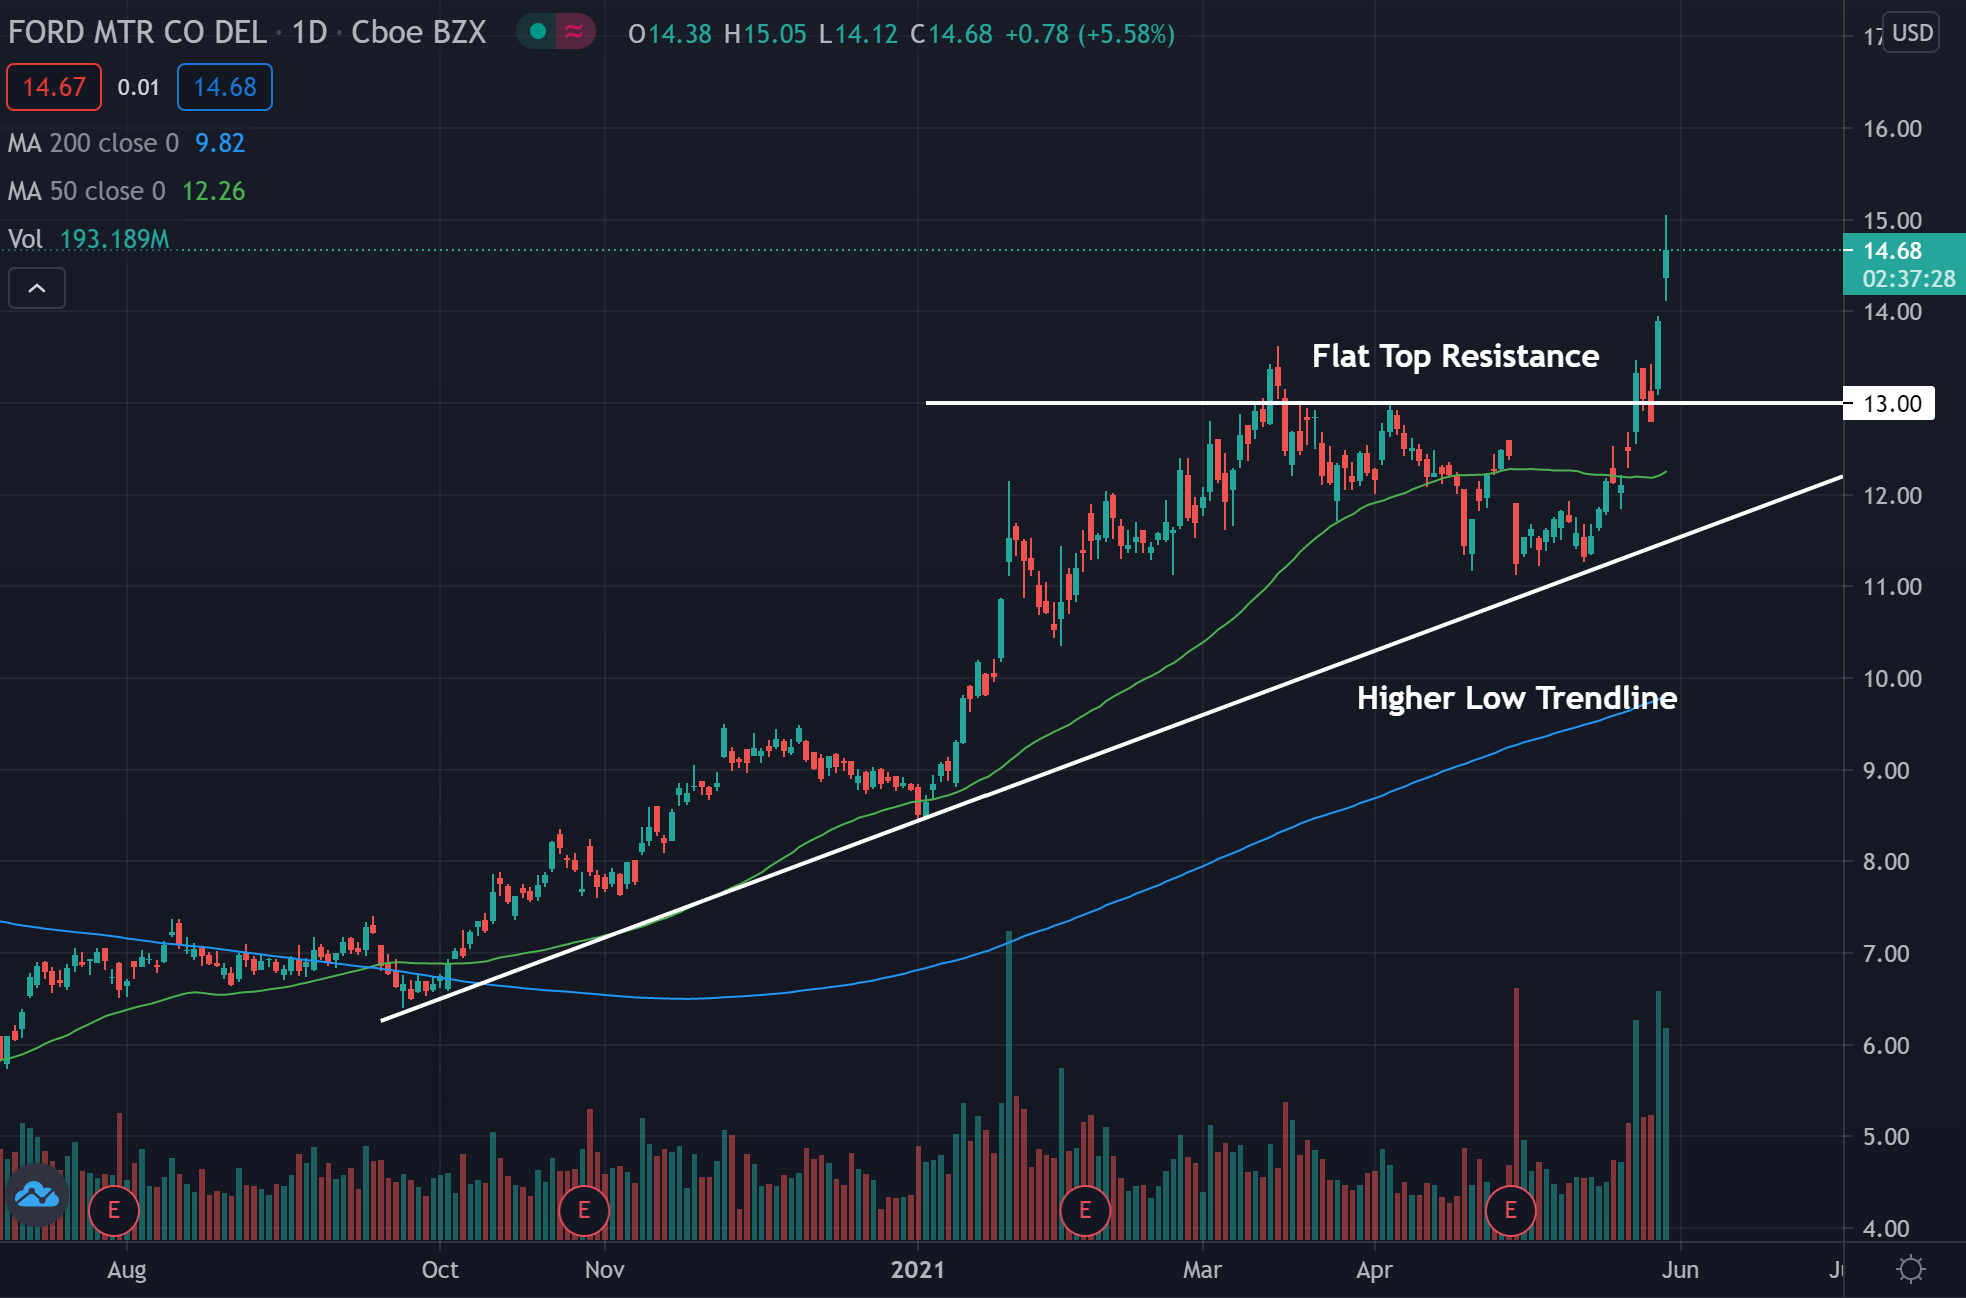
- Ford looks to have broken out of what technical traders may call an ascending triangle pattern.
- The stock is trading above both the 50-day moving average (green) and the 200-day moving average (blue), indicating sentiment is most likely bullish.
- Both of these moving averages may hold as an area of support.
-
See also: How to Buy Ford Stock
Key Ford Levels To Watch
- The ascending triangle pattern is a bullish continuation pattern that occurs when higher lows are squeezed between a flat top resistance. Ford may have broken out of the ascending triangle pattern and could head higher.
- Previously, the $13 level held as resistance before the cryptocurrency was able to break above the level.
- Now the $13 level may hold as an area of support. Another area of possible support is along the trendline that is formed by the higher lows.
What’s Next For Ford?
Bullish technical traders would like to see the stock continue to build higher lows and stay above the higher low trendline. As long as the stock is able to hold above the higher low trendline, bulls should hold control.
Bearish technical traders would like to see the stock fall back below the higher low trendline. A cross below this trendline could signal that bears are taking control, and the stock may see a strong push downwards.
Photo courtesy of Ford.
Edge Rankings
Price Trend
© 2025 Benzinga.com. Benzinga does not provide investment advice. All rights reserved.
Trade confidently with insights and alerts from analyst ratings, free reports and breaking news that affects the stocks you care about.