Nokia Oyj NOK has pumped out 20 separate news releases this month and is a leading vendor in the telecommunications equipment industry. The company has also been the successful target of a short squeeze in the past.
Even though Nokia has a massive 4.64-billion-share float, it was targeted alongside GameStop Corporation GME and AMC Entertainment Holdings Inc AMC in January in an epic short squeeze.
Although Nokia’s big squeeze only lasted a single day, its share price skyrocketed 106% on Jan. 27 before falling back to earth Jan. 28.
Over the month of May, Nokia’s stock price has been creeping up, and traders may be wondering if another squeeze is in the cards.
As of May 14, Nokia had 33.28 million shares held short as opposed to the 28.23 million shares held short on April 15.
What A Short Squeeze Means: A short squeeze generally occurs when a massive amount of buying pressure, in both common shares and call options, suddenly pushes prices higher.
Institutions holding short positions on the stock become nervous, decide to cut their losses and exit their positions, causing the price of the stock to shoot up further and quickly.
Stocks that make good short squeeze candidates have a large percentage of their total shares held in a short position.
It is difficult to predict when a short squeeze will occur with any individual stock but, on a chart, traders can watch for big bullish volume to enter.
See Also: How to Buy Nokia Stock Right Now
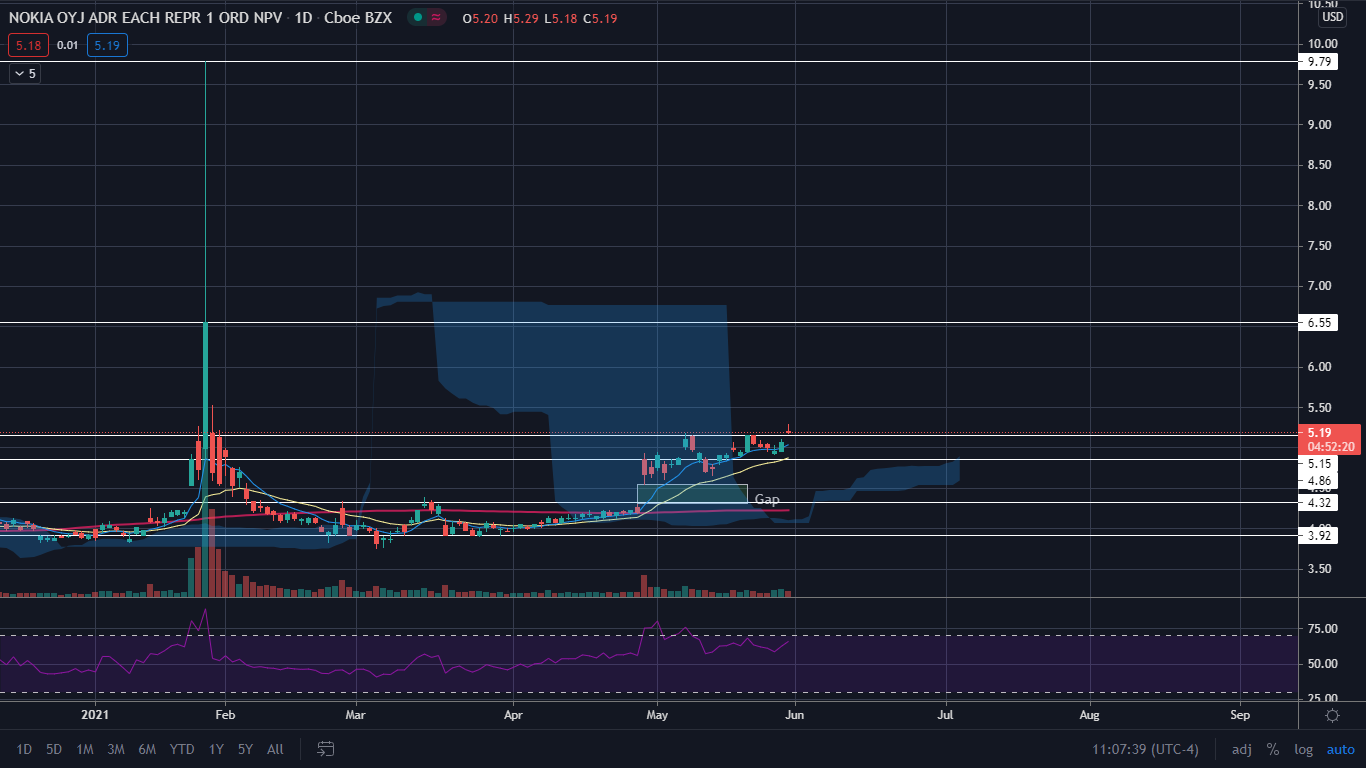
The Nokia Chart: On Jan. 25, two days before Nokia’s colossal squeeze, huge bullish volume entered the stock.
Although Nokia’s volume has increased in the last two trading days, it has yet to see a volume bar equal to what occurred prior to the last big squeeze, although that could change over the course of Friday.
On Friday morning, Nokia gapped up over resistance at $5.15 and began to consolidate on lower timeframes. The move over $5.15 is only the second time Nokia’s stock has breached the resistance level since October 2019, and there is no further resistance above in the form of recent price history, until its Jan. 27 closing price of $6.55.
Nokia is trading above the eight-day and 21-day exponential moving averages, with the eight-day EMA trending above the 21-day EMA, which is bullish.
Nokia is also trading above the 200-day simple moving average, which indicates overall sentiment in the stock is bullish.
 Bulls want to see sustained or increasing bullish volume push Nokia’s stock higher with momentum. A large amount of buyers purchasing the stock at the same time could cause shorts to cover.
Bears want to see Nokia’s stock drop back down below the $5.15 mark and for it to retrace back down toward $4.86. There is a gap left behind from April 29 in the $4 range that will likely be filled at some point in the future.
NOK Price Action: Shares of Nokia were trading up 1.87% at $5.16 at last check Friday.
Edge Rankings
Price Trend
© 2025 Benzinga.com. Benzinga does not provide investment advice. All rights reserved.
Trade confidently with insights and alerts from analyst ratings, free reports and breaking news that affects the stocks you care about.