Atossa Therapeutics Inc. ATOS shares are trading higher Monday after the company announced it will release the final data from its Phase 2 study of endoxifen administered to breast cancer patients prior to surgery. The company will announce the results of the study June 9, at 8 a.m. PST.
Atossa Therapeutics was up 27.92% at $5.91 at last check.

Atossa Therapeutics Daily Chart Analysis:
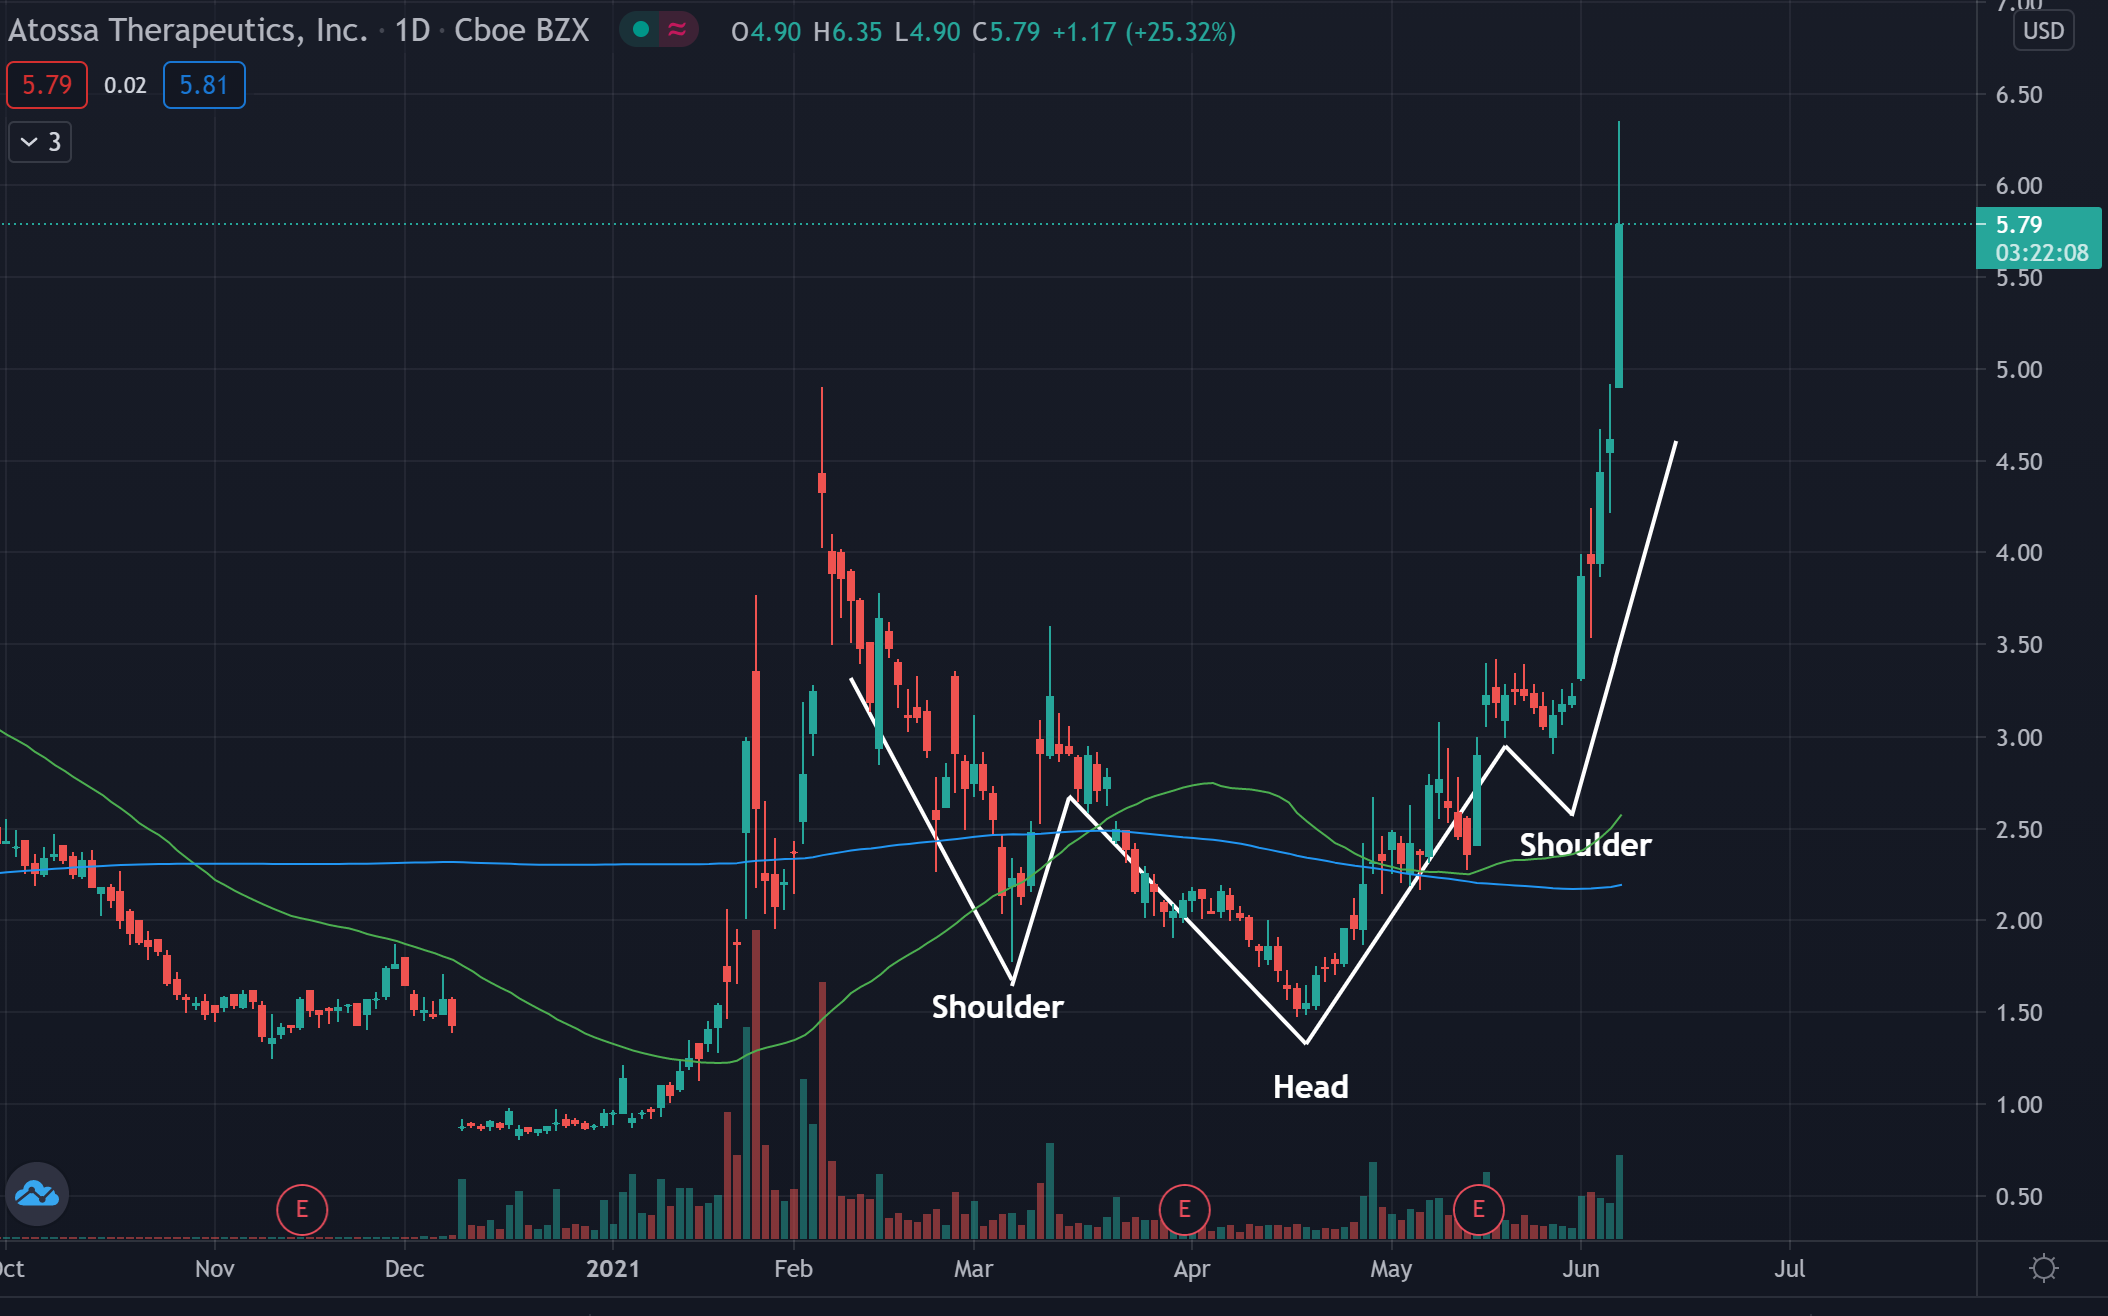
- Shares were falling the past few months, but have since come back trading in what technical traders may call an inverse head and shoulders pattern.
- The stock is trading above the 50-day moving average (green), and above the 200-day moving average (blue), indicating sentiment in the stock is bullish.
- Each of these moving averages may hold as an area of support in the future.
Key Levels To Watch:
- Atossa Therapeutics formed into an inverse head and shoulders pattern and has been heading higher throughout the past month.
- This bullish reversal pattern happens after the stock falls and makes a pair of lower lows, then the stock makes another low equal to the first, creating the head and both shoulders before the stock makes its run-up and changes trends.
- The stock may need to see consolidation before long traders may think about an entry.
What’s Next?
Bullish technical traders would like to see the stock consolidate for a time before the stock may see another move. If the news is good from the announcement, bulls would also like to see the stock consolidate and hold the gains and another move up may be possible.
Bearish technical traders would like to see the stock fall back to the shoulders or the head in the pattern. Bearish traders would like to see the stock fall below the moving averages as well to see a trend change.
Edge Rankings
Price Trend
© 2025 Benzinga.com. Benzinga does not provide investment advice. All rights reserved.
Trade confidently with insights and alerts from analyst ratings, free reports and breaking news that affects the stocks you care about.