Nano Dimension LTD. NNDM shares were trading higher Wednesday as retail traders pushed the stock higher.
The stock was trending throughout the day on social media sites such as StockTwits. The stock trades with a float of 184 million shares and a short percentage of 16%.
Nano Dimension was up 7.8% at $8.70 at last check.

Nano Dimension Daily Chart Analysis
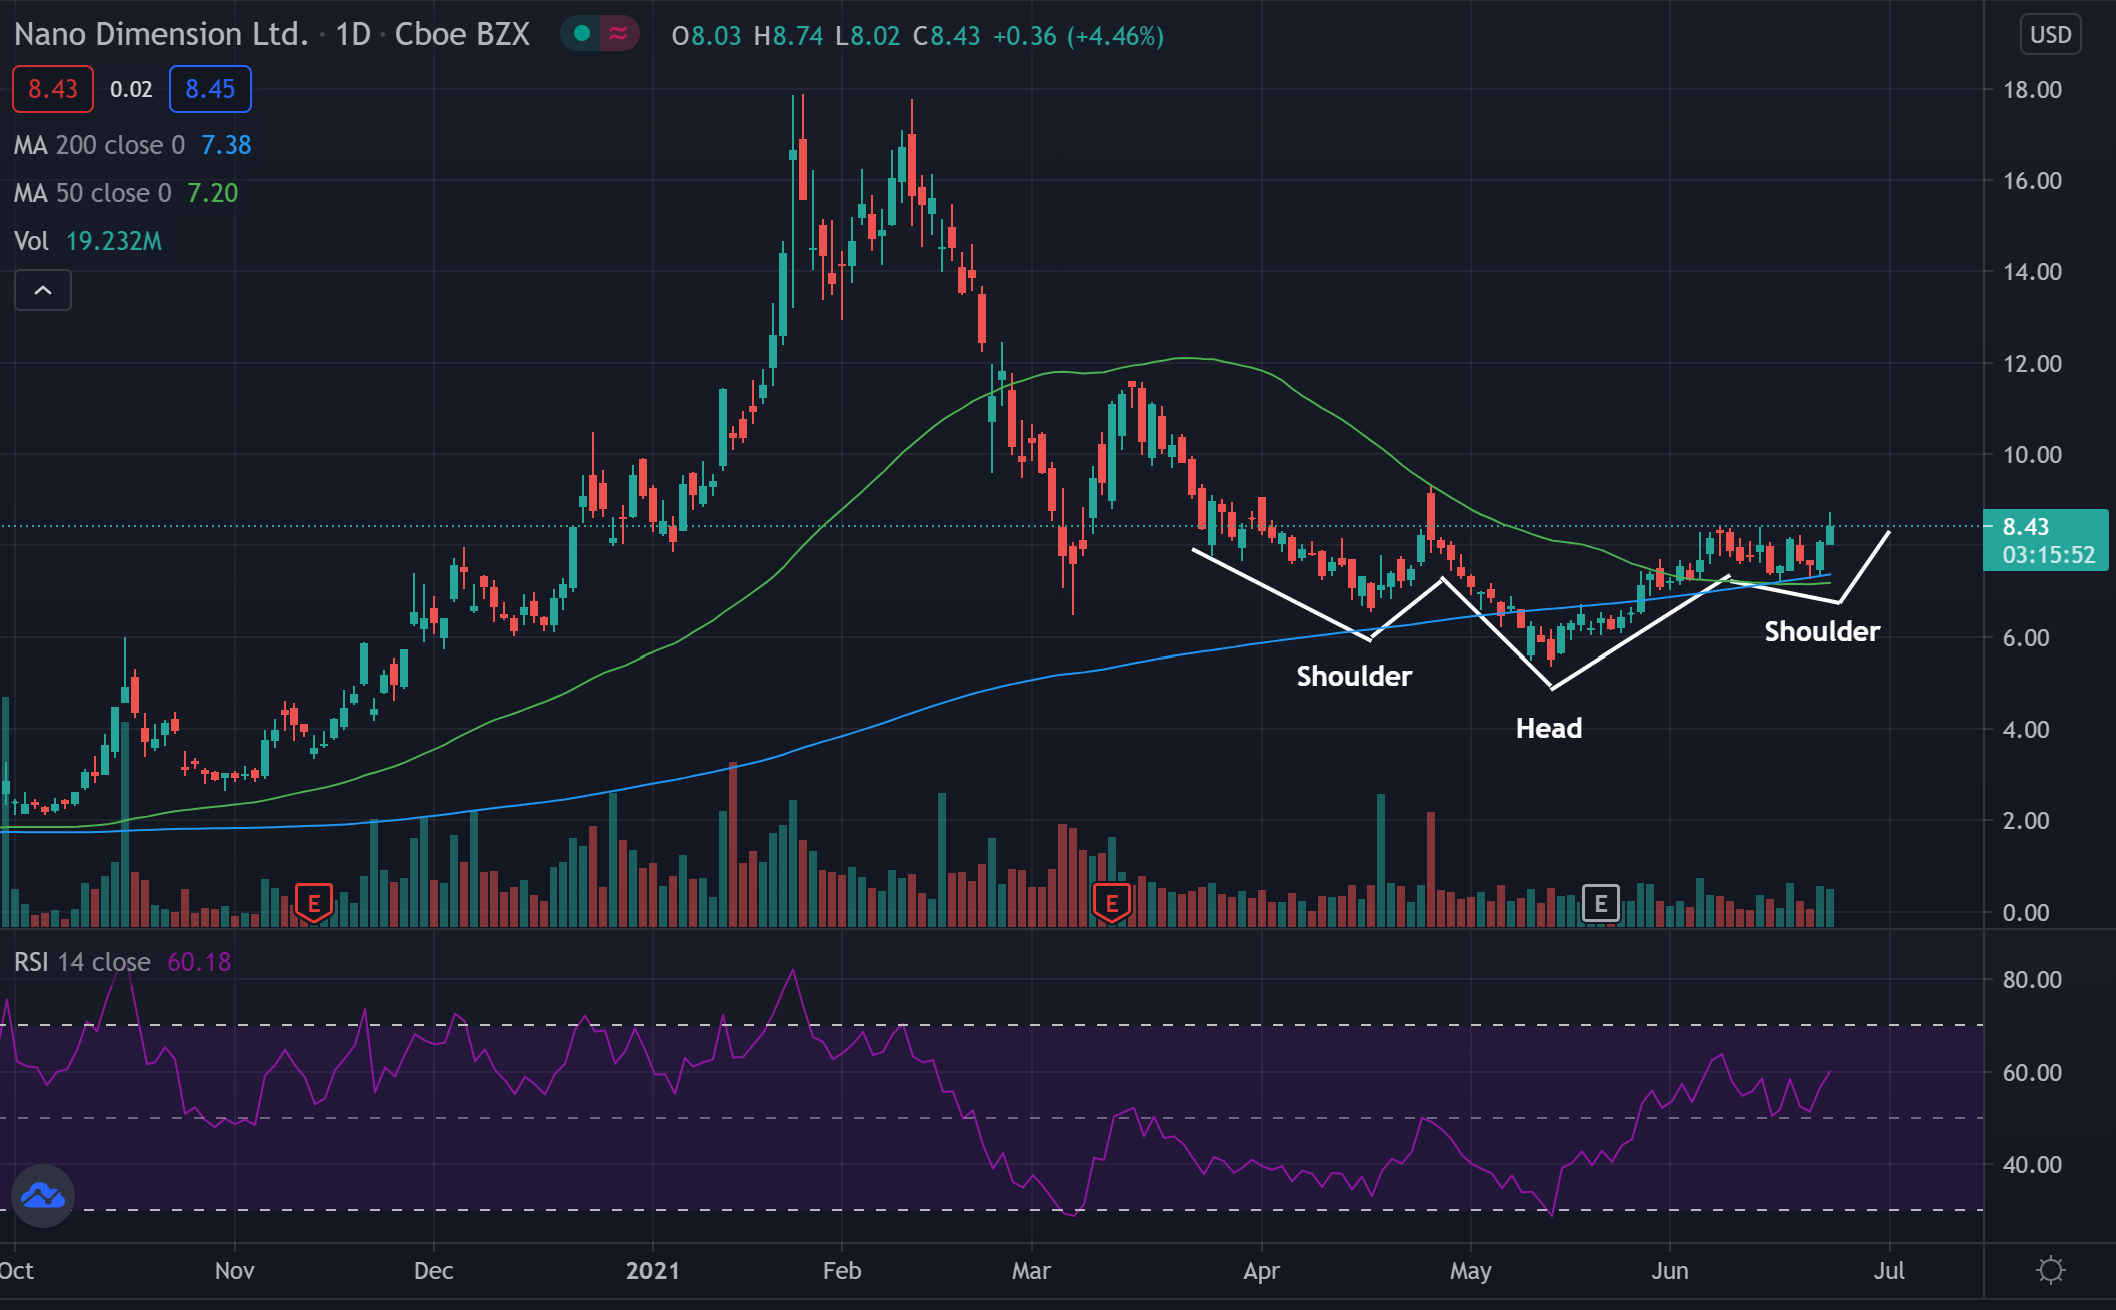
- Shares have been forming into what technical traders could call an inverse head and shoulders pattern.
- The stock is trading above the 50-day moving average (green), and the 200-day moving average (blue), indicating sentiment in the stock is likely bullish.
- Each of these moving averages may hold as an area of support.
Key Nano Dimension Levels To Watch
- The stock has been forming an inverse head and shoulders pattern and looks as though it could see a nice move in the coming weeks.
- The inverse head and shoulders pattern is a bullish reversal pattern that occurs when the stock stops making lower lows and begins to make higher lows.
- The Relative Strength Index (RSI) shows that the stock has been coiling up above the 50 mark on the indicator. This means there are more buyers than sellers in the stock and it may be gearing up to make a move.
What’s Next For Nano Dimension?
Bullish technical traders would like to see the stock confirm the inverse head and shoulders pattern and see a bullish move. Bulls would like to see the RSI remain high while the stock moves up.
Bearish technical traders would like to see the stock fall below the pattern. If the stock was able to break below the lines forming the pattern as well as the moving averages, it may be ready to see a bearish move. Below the moving averages and sentiment in the stock may change as well.
Edge Rankings
Price Trend
© 2025 Benzinga.com. Benzinga does not provide investment advice. All rights reserved.
Trade confidently with insights and alerts from analyst ratings, free reports and breaking news that affects the stocks you care about.