Golden Nugget Online Gaming Inc. GNOG shares traded higher Thursday after B. Riley Securities initiated coverage on the stock with a Buy rating and a $27 price target.
Golden Nugget Online Gaming was up 9.2% at $12.11 at last check.

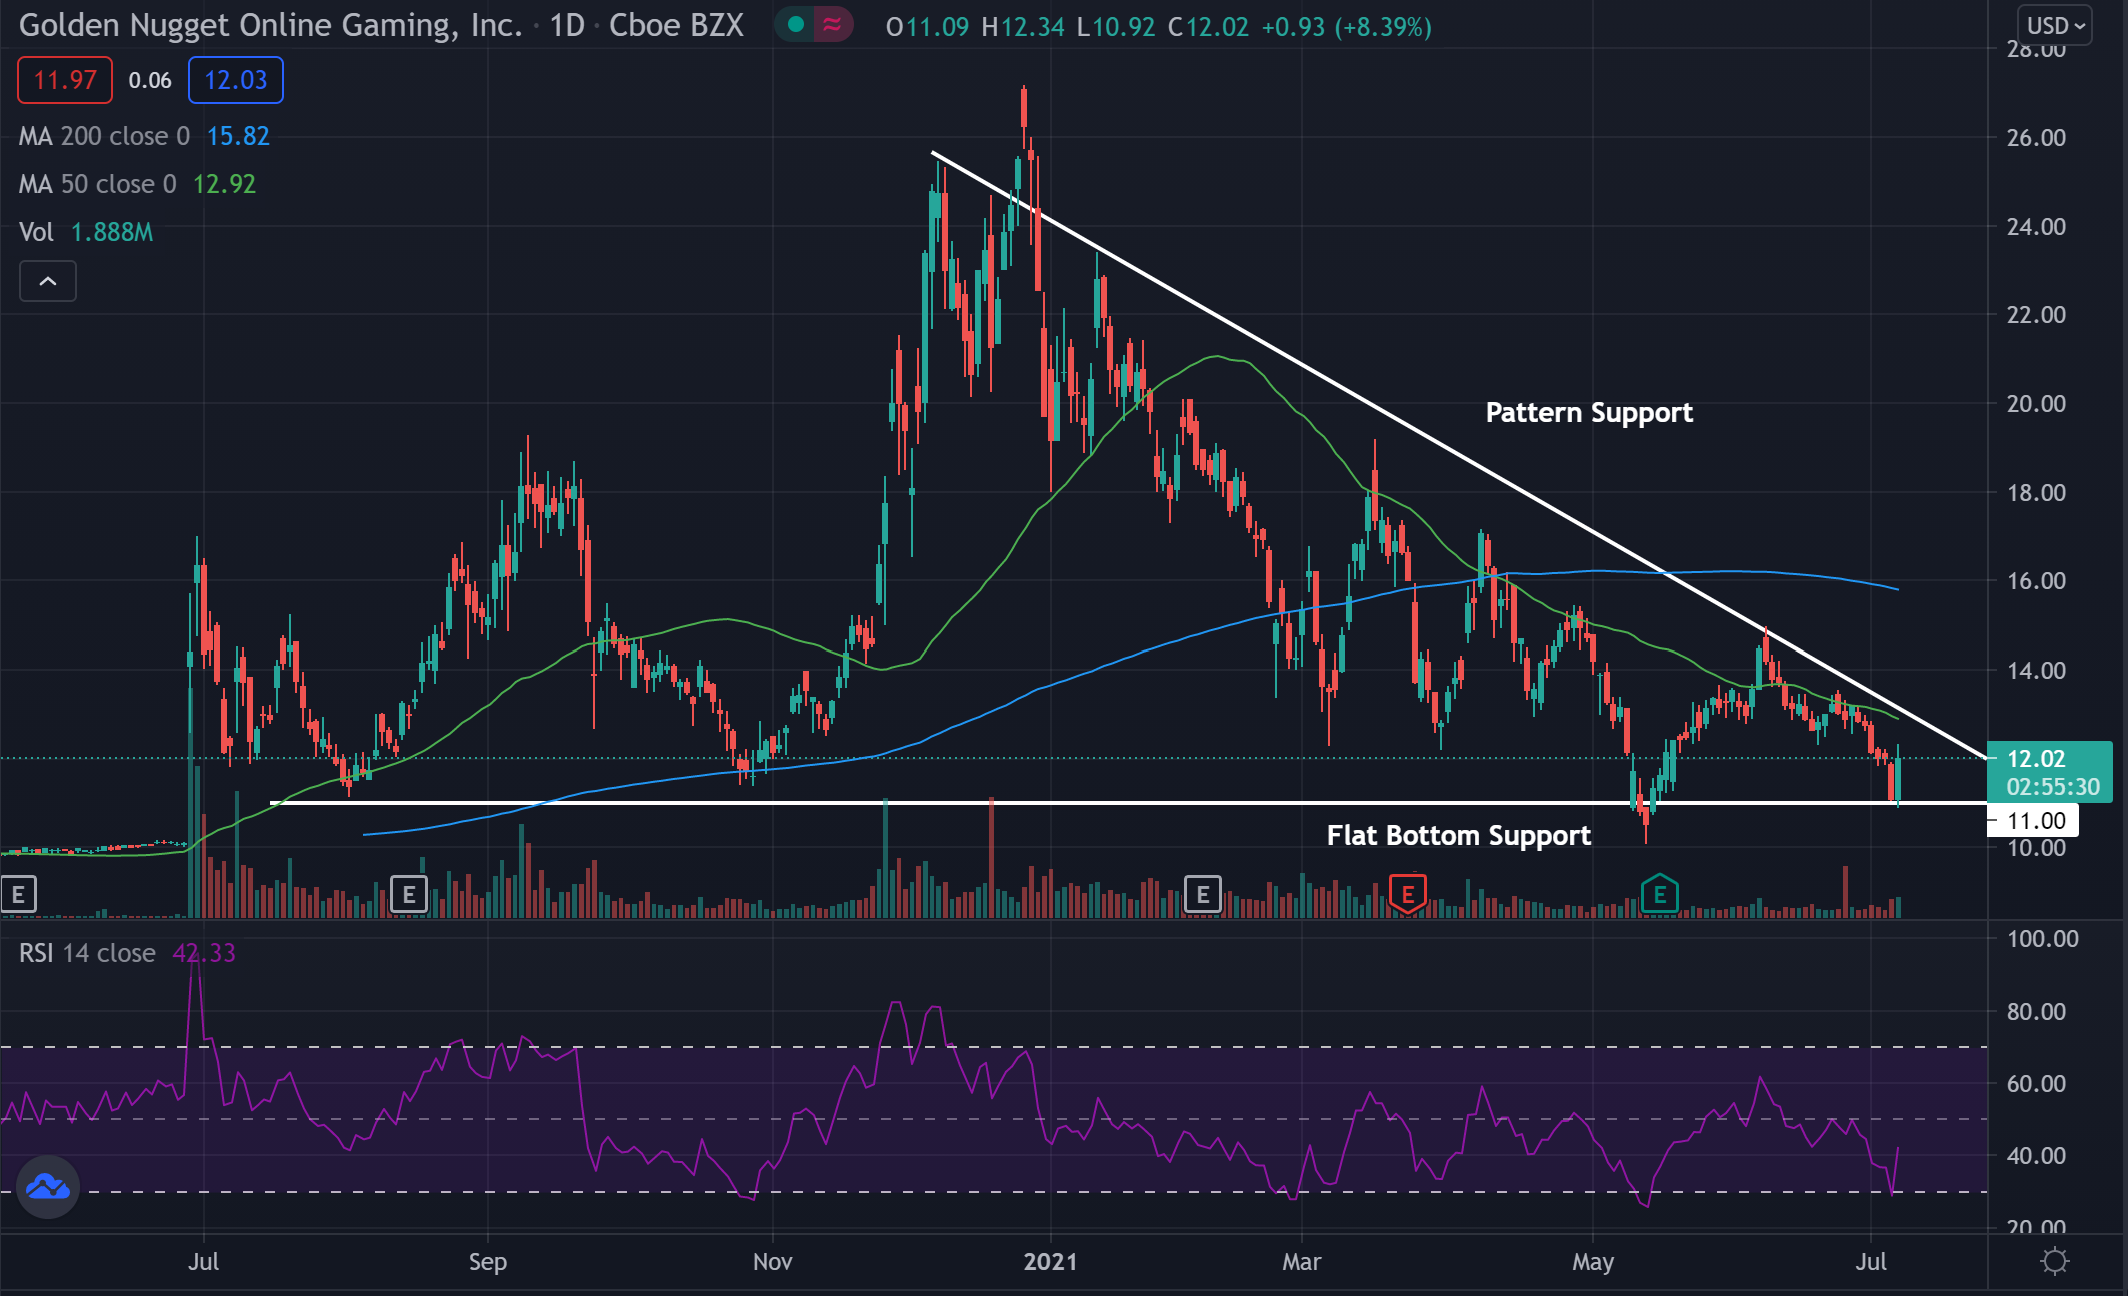
Golden Nugget Online Gaming Daily Chart Analysis
- Shares look to be trading within a descending triangle pattern and could be due for more of a drop if the bottom support is broken.
- The stock is trading below both the 50-day moving average (green), and the 200-day moving average (blue), indicating sentiment in the stock has been bearish.
- Each of these moving averages may hold as a possible area of resistance in the future.
Key Golden Nugget Online Gaming Levels To Watch
- The stock has been in a downtrend the past few months and trades within a descending triangle pattern with flat bottom support.
- The flat bottom support is near the $11 level. This area has held as support multiple times in the past and could again.
- Connecting the highs on the chart shows the stock has been in a downtrend. The line that connects the highs can be called the pattern resistance and a break above these lines could signal that a trend change is coming.
What’s Next For Golden Nugget Online Gaming?
Bullish traders would like to see the stock bounce and start heading back up. Bulls would like to see the stock cross above the pattern resistance and see a trend change. Bulls would also like to see the stock cross above the moving averages.
Bearish traders would like to see the stock break below the support level near $11 and see a push lower. Right now it looks as though bears are in control with a bearish pattern being formed and the stock trading below both moving averages.
© 2025 Benzinga.com. Benzinga does not provide investment advice. All rights reserved.
Trade confidently with insights and alerts from analyst ratings, free reports and breaking news that affects the stocks you care about.