Nokia Corp. NOK shares were trading higher Tuesday after the company announced it expects to revise its 2021 financial guidance.
The company will release its second quarter and half-year 2021 financial results on Thursday, July 29.
Nokia was up 11.56% at $5.99 at last check.
Nokia Daily Chart Analysis
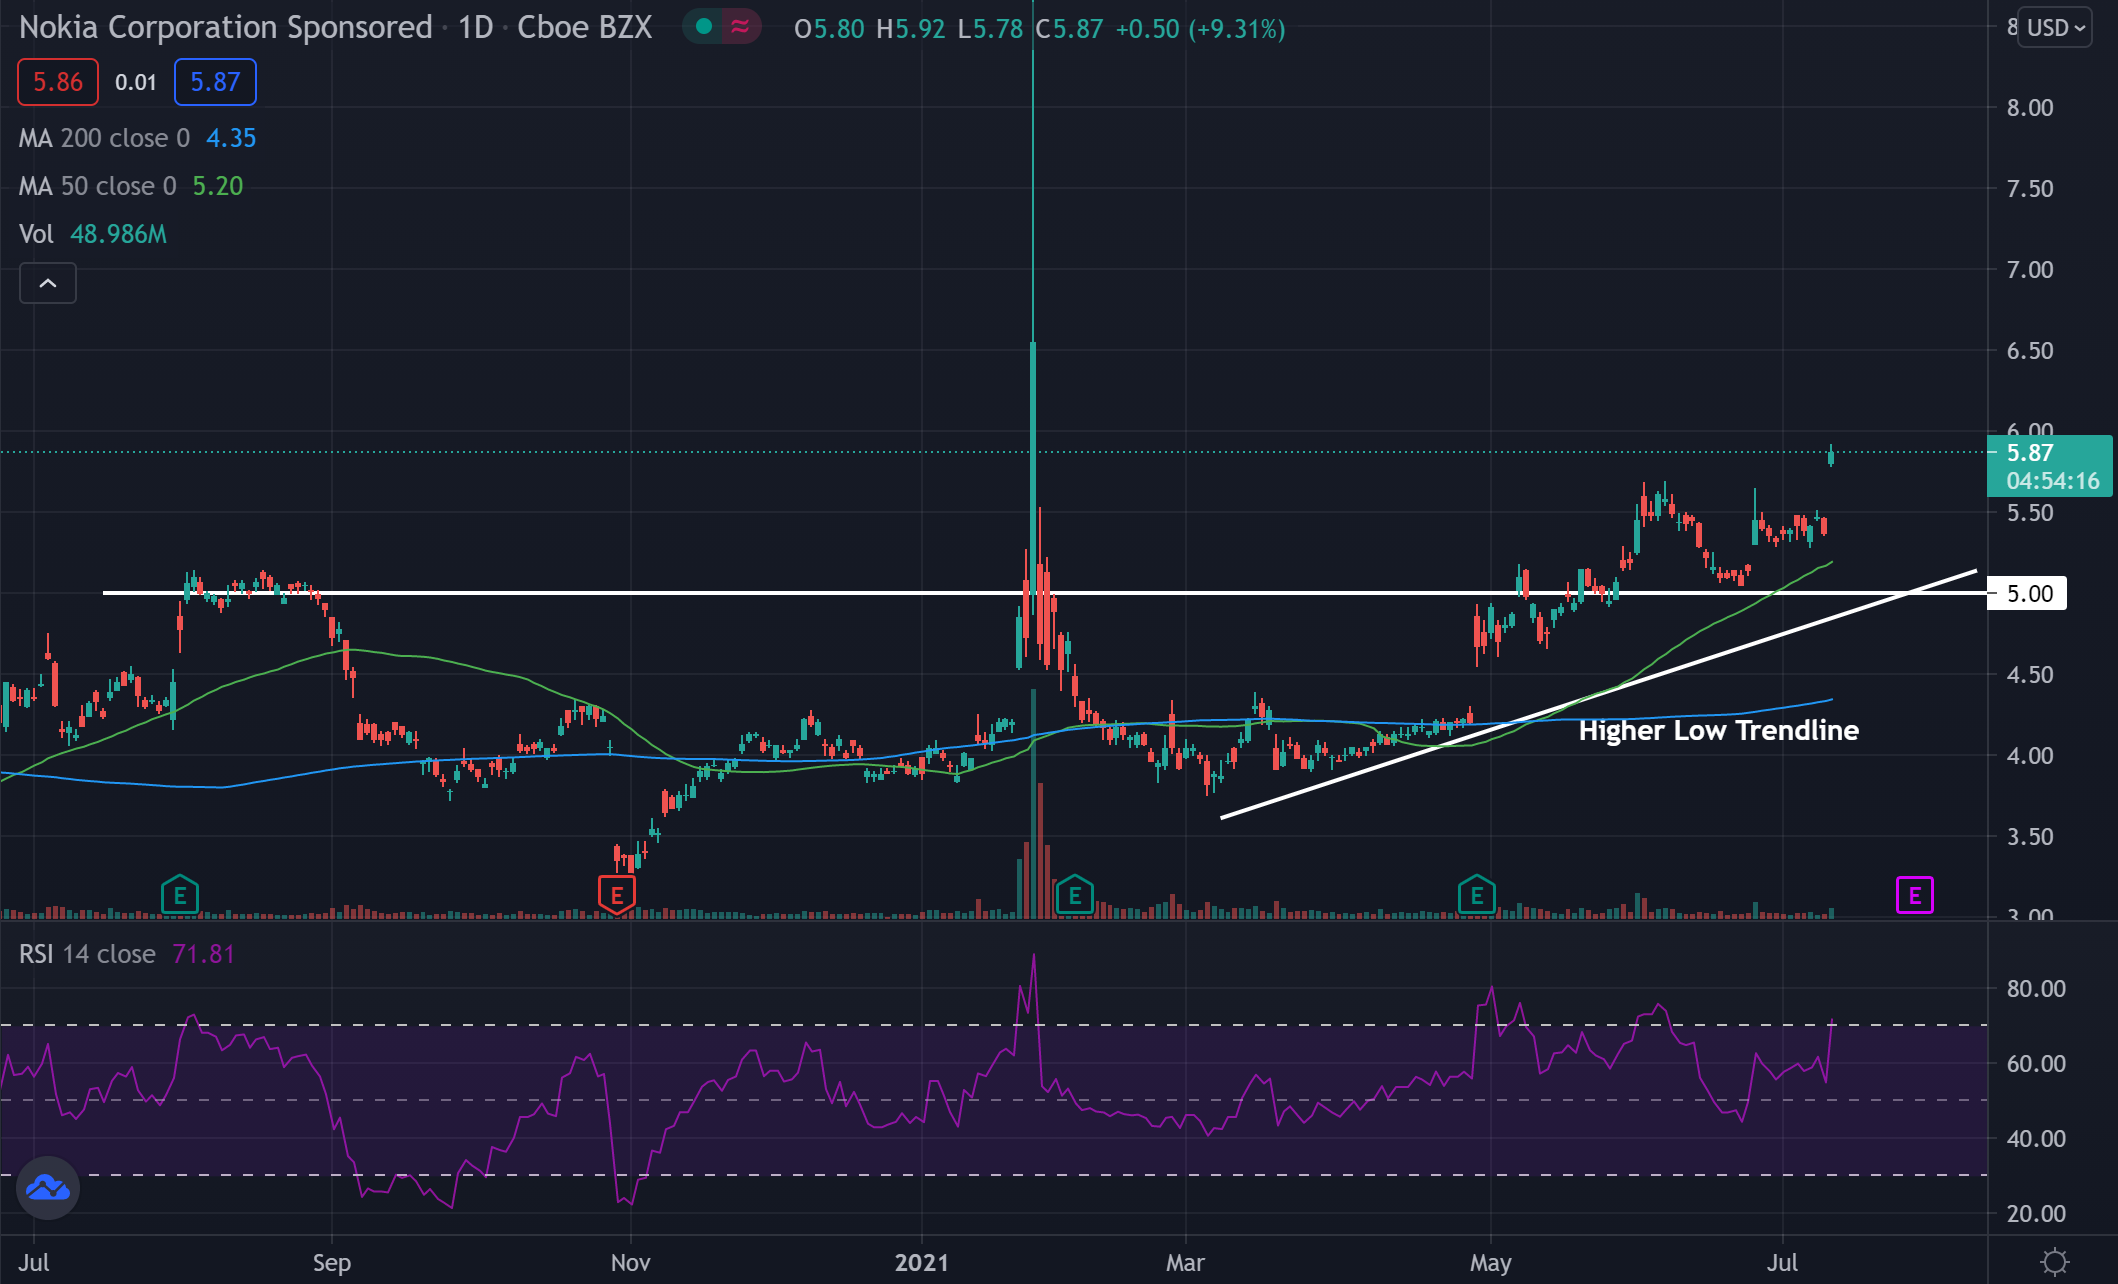
- Shares look to have broken out of an ascending triangle pattern, and were able to retest the resistance line as support.
- The stock is trading above both the 50-day moving average (green), and the 200-day moving average (blue), indicating the sentiment in the stock is bullish.
- Each of these moving averages may hold as an area of support in the future.
Key Nokia Levels To Watch
- The stock broke out of the ascending triangle pattern and then went on to retest the resistance level as support. The support held and now the stock has continued higher.
- The $5 level was an area where the stock was showing resistance before it broke out. The stock broke out, then came back down to this level and bounced before moving back up.
- The higher low trendline may continue to hold as support as the stock continues climbing. With a break below, the stock could see a trend change.
What’s Next For Nokia?
Bullish traders would like to see the stock continue to trade above the higher low trendline. Bulls hold the trend and may continue to as long as the stock can hold.
Bearish traders would like to see the stock fall below the higher low trendline. If the stock can fall below the higher low trendline it could signal that a trend is changing. Bears would like to see the stock fall below the moving averages.
Edge Rankings
Price Trend
© 2025 Benzinga.com. Benzinga does not provide investment advice. All rights reserved.
Trade confidently with insights and alerts from analyst ratings, free reports and breaking news that affects the stocks you care about.