
The Boeing Company BA shares were trading lower Tuesday after the company announced a cut in 787 production levels and said it expects to deliver fewer than half of the 787s in inventory this year.
Boeing was down 3.81% at $229.21 at last check.
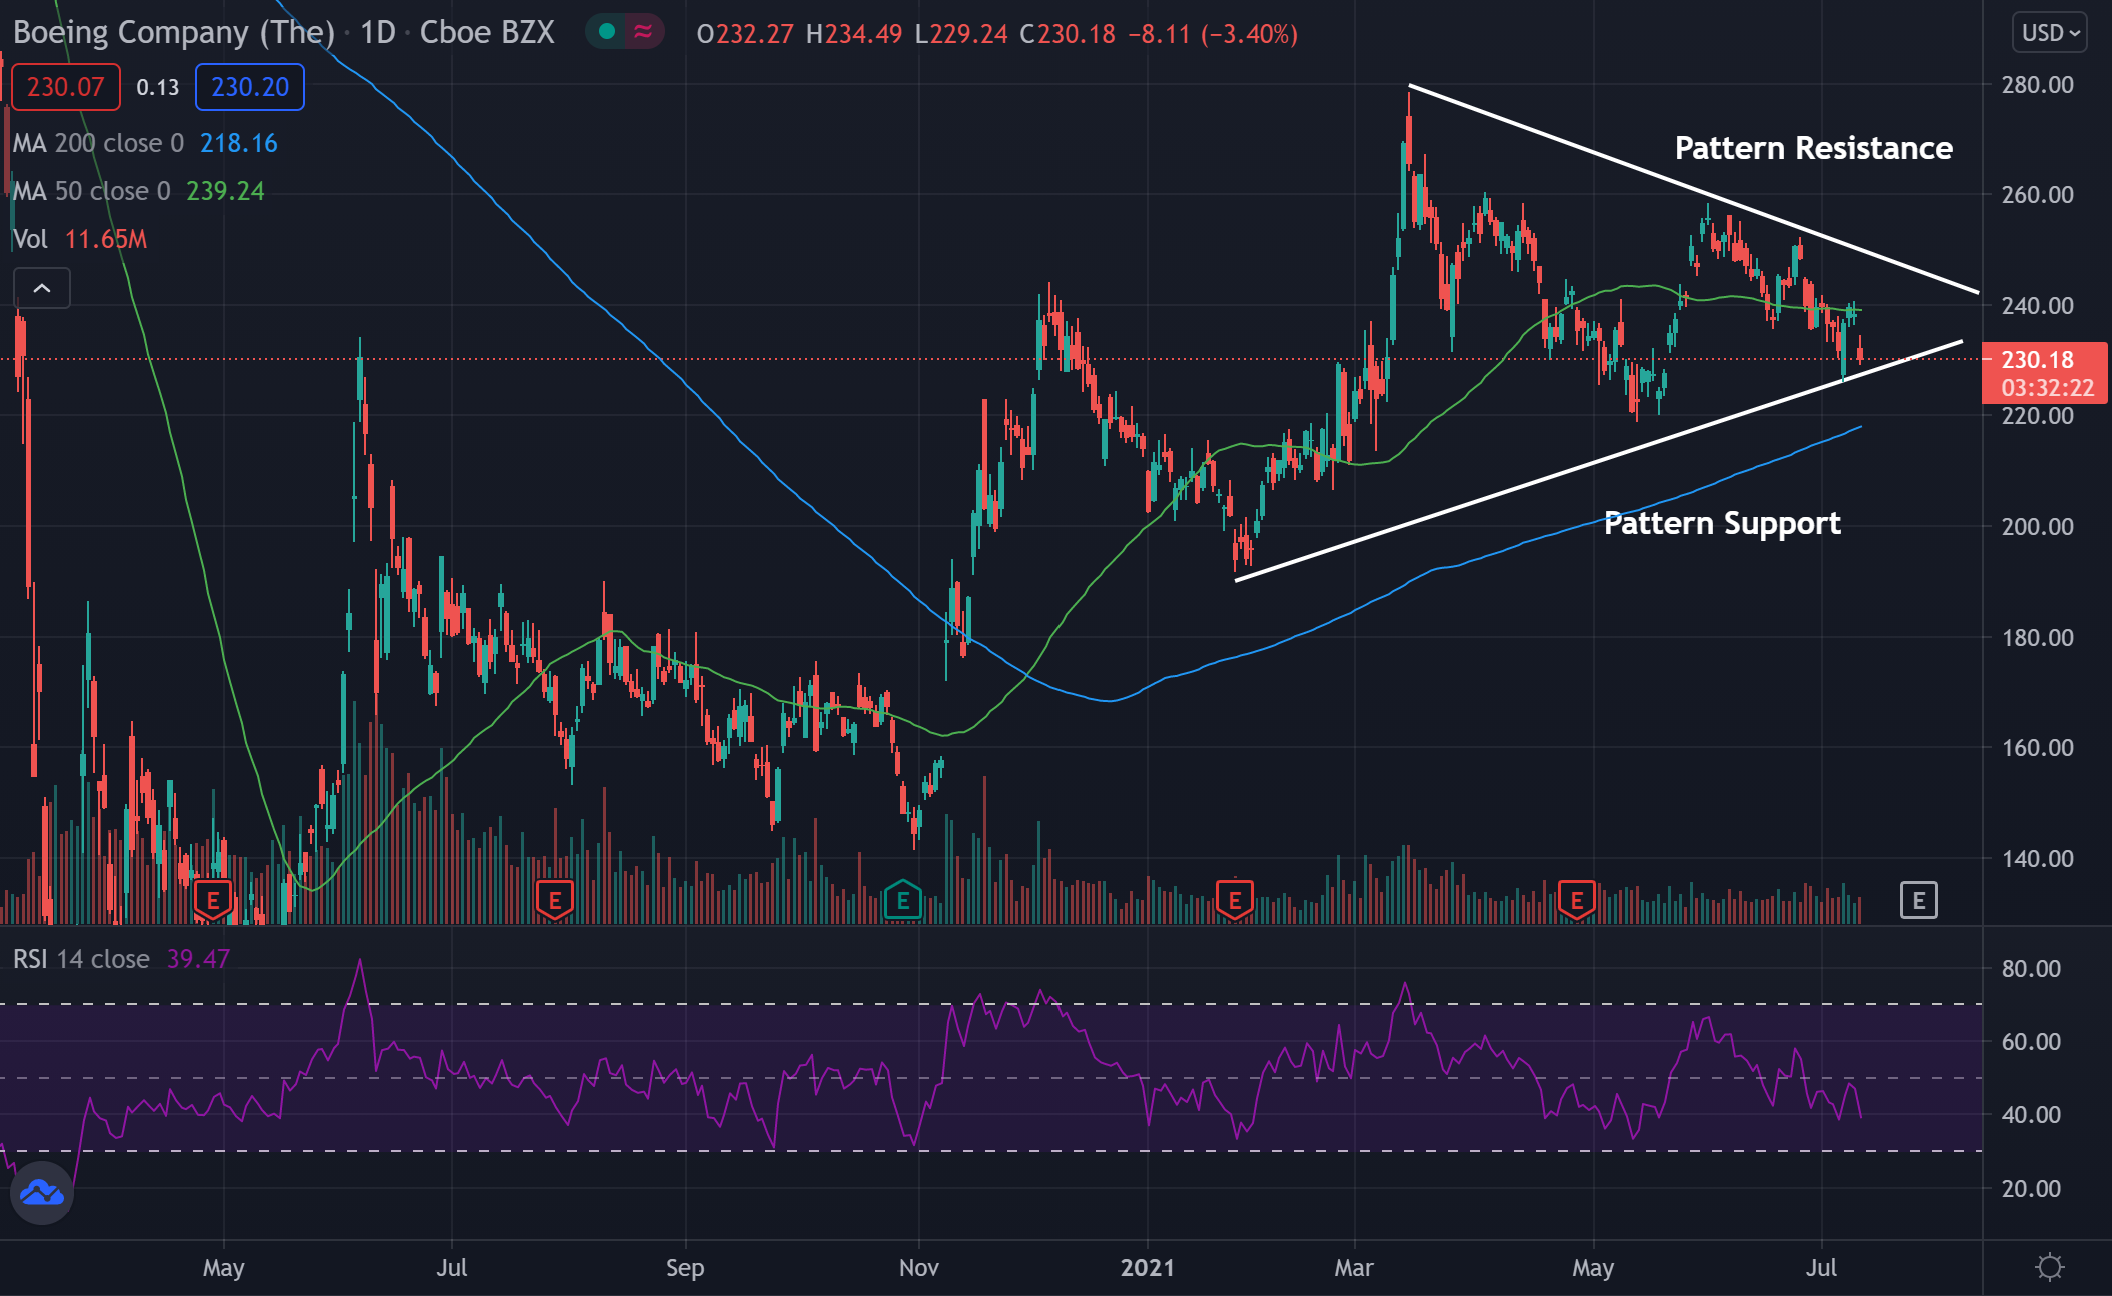
Boeing Daily Chart Analysis
- Shares are forming into what technical traders would call a pennant pattern and could break out within the coming weeks.
- The stock is trading below the 50-day moving average (green), but above the 200-day moving average (blue), indicating the stock is likely facing a period of consolidation.
- The 50-day moving average may hold as an area of resistance, while the 200-day moving average may act as a place of support.
Key Boeing Levels To Watch
- The pennant pattern began forming in early 2021, and may see a breakout within the next couple weeks if pattern resistance can be broken.
- The price will likely continue to be condensed between narrowing highs and lows until the stock is able to break above the pattern support or resistance and possibly see a strong move in the same direction.
- The Relative Strength Index (RSI) has been falling lately and sits below 50. The RSI is sitting at 39, meaning that there are more sellers in the stock than there are buyers. If this indicator can cross below the 30 leve, it will become oversold and likely dip further.
What’s Next For Boeing?
Bulls would like to see the stock continue to trade within the pennant pattern until it is able to break above pattern resistance. A break above pattern resistance could bring about a further stronger bullish move.
Bears would like to see the stock break below the pattern support. If the stock was able to break below the pattern support it could see a large bearish push. Bears would like to see the stock fall below the moving averages.
Edge Rankings
Price Trend
© 2025 Benzinga.com. Benzinga does not provide investment advice. All rights reserved.
Trade confidently with insights and alerts from analyst ratings, free reports and breaking news that affects the stocks you care about.

