The SPDR S&P 500 ETF Trust SPY has formed a classic rectangle pattern on its chart. This type of pattern illustrates a period of sideways trading or consolidation.
The top of the range has been around the $442 level. Over the past two weeks, each time SPY got close to it, the sellers overpowered the buyers. There was more than enough supply to fill all of the demand, then shares went lower.
The bottom of the range has been around the $437 level. Each time that SPY fell to it, there was enough demand to absorb all of the supply. The buyers overpowered the sellers and pushed the price higher.
Traders are watching these levels closely. Until one of them breaks, SPY will continue to trade sideways.
See also: Best Exchange Traded Funds (ETFs)
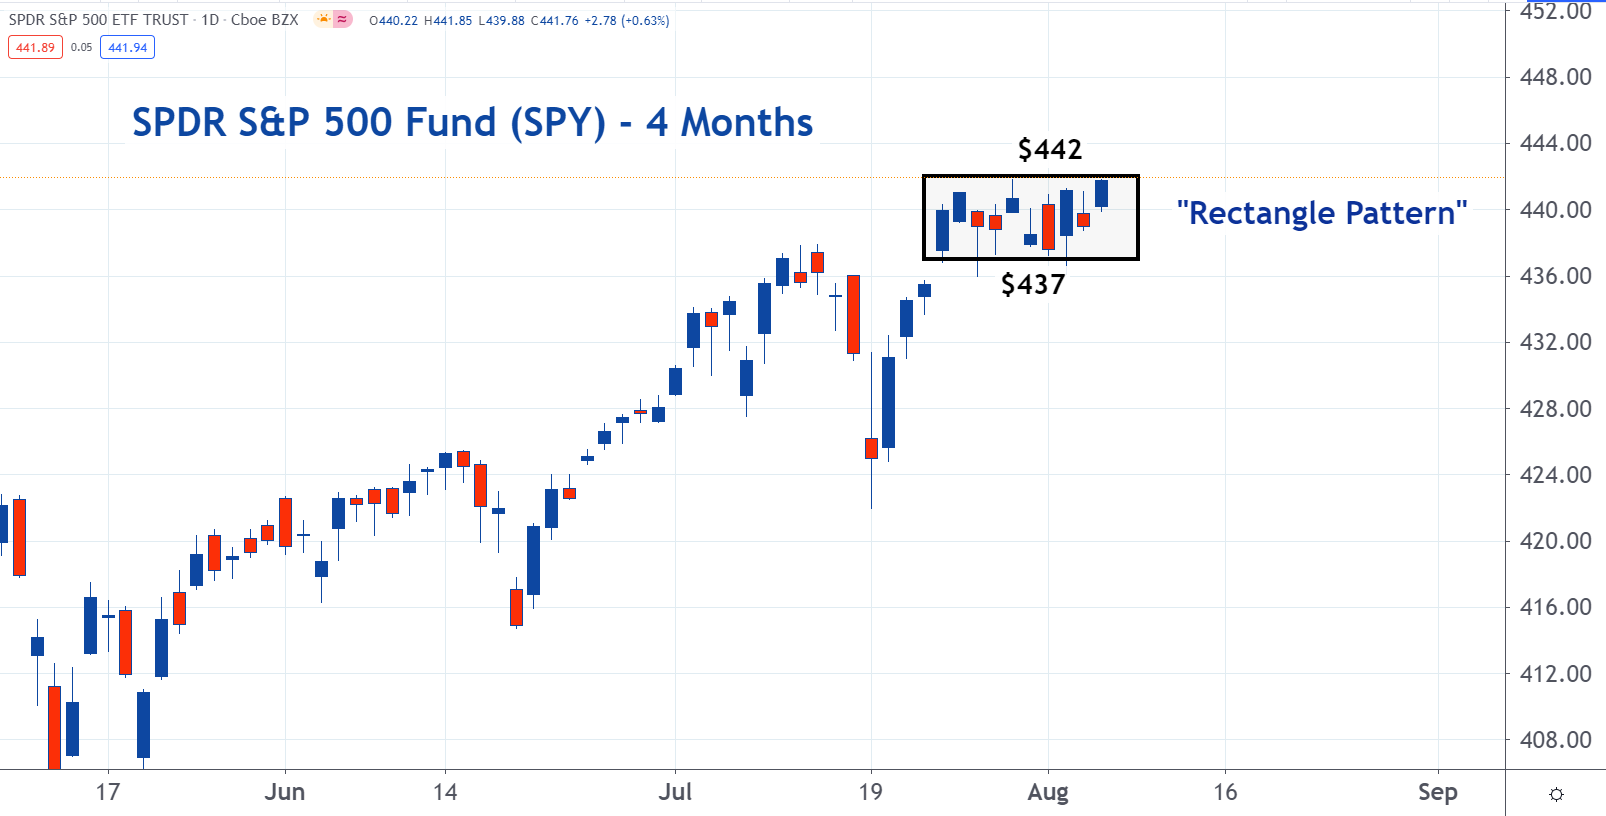
Photo: Artem Podrez from Pexels
© 2024 Benzinga.com. Benzinga does not provide investment advice. All rights reserved.
Comments
Trade confidently with insights and alerts from analyst ratings, free reports and breaking news that affects the stocks you care about.

