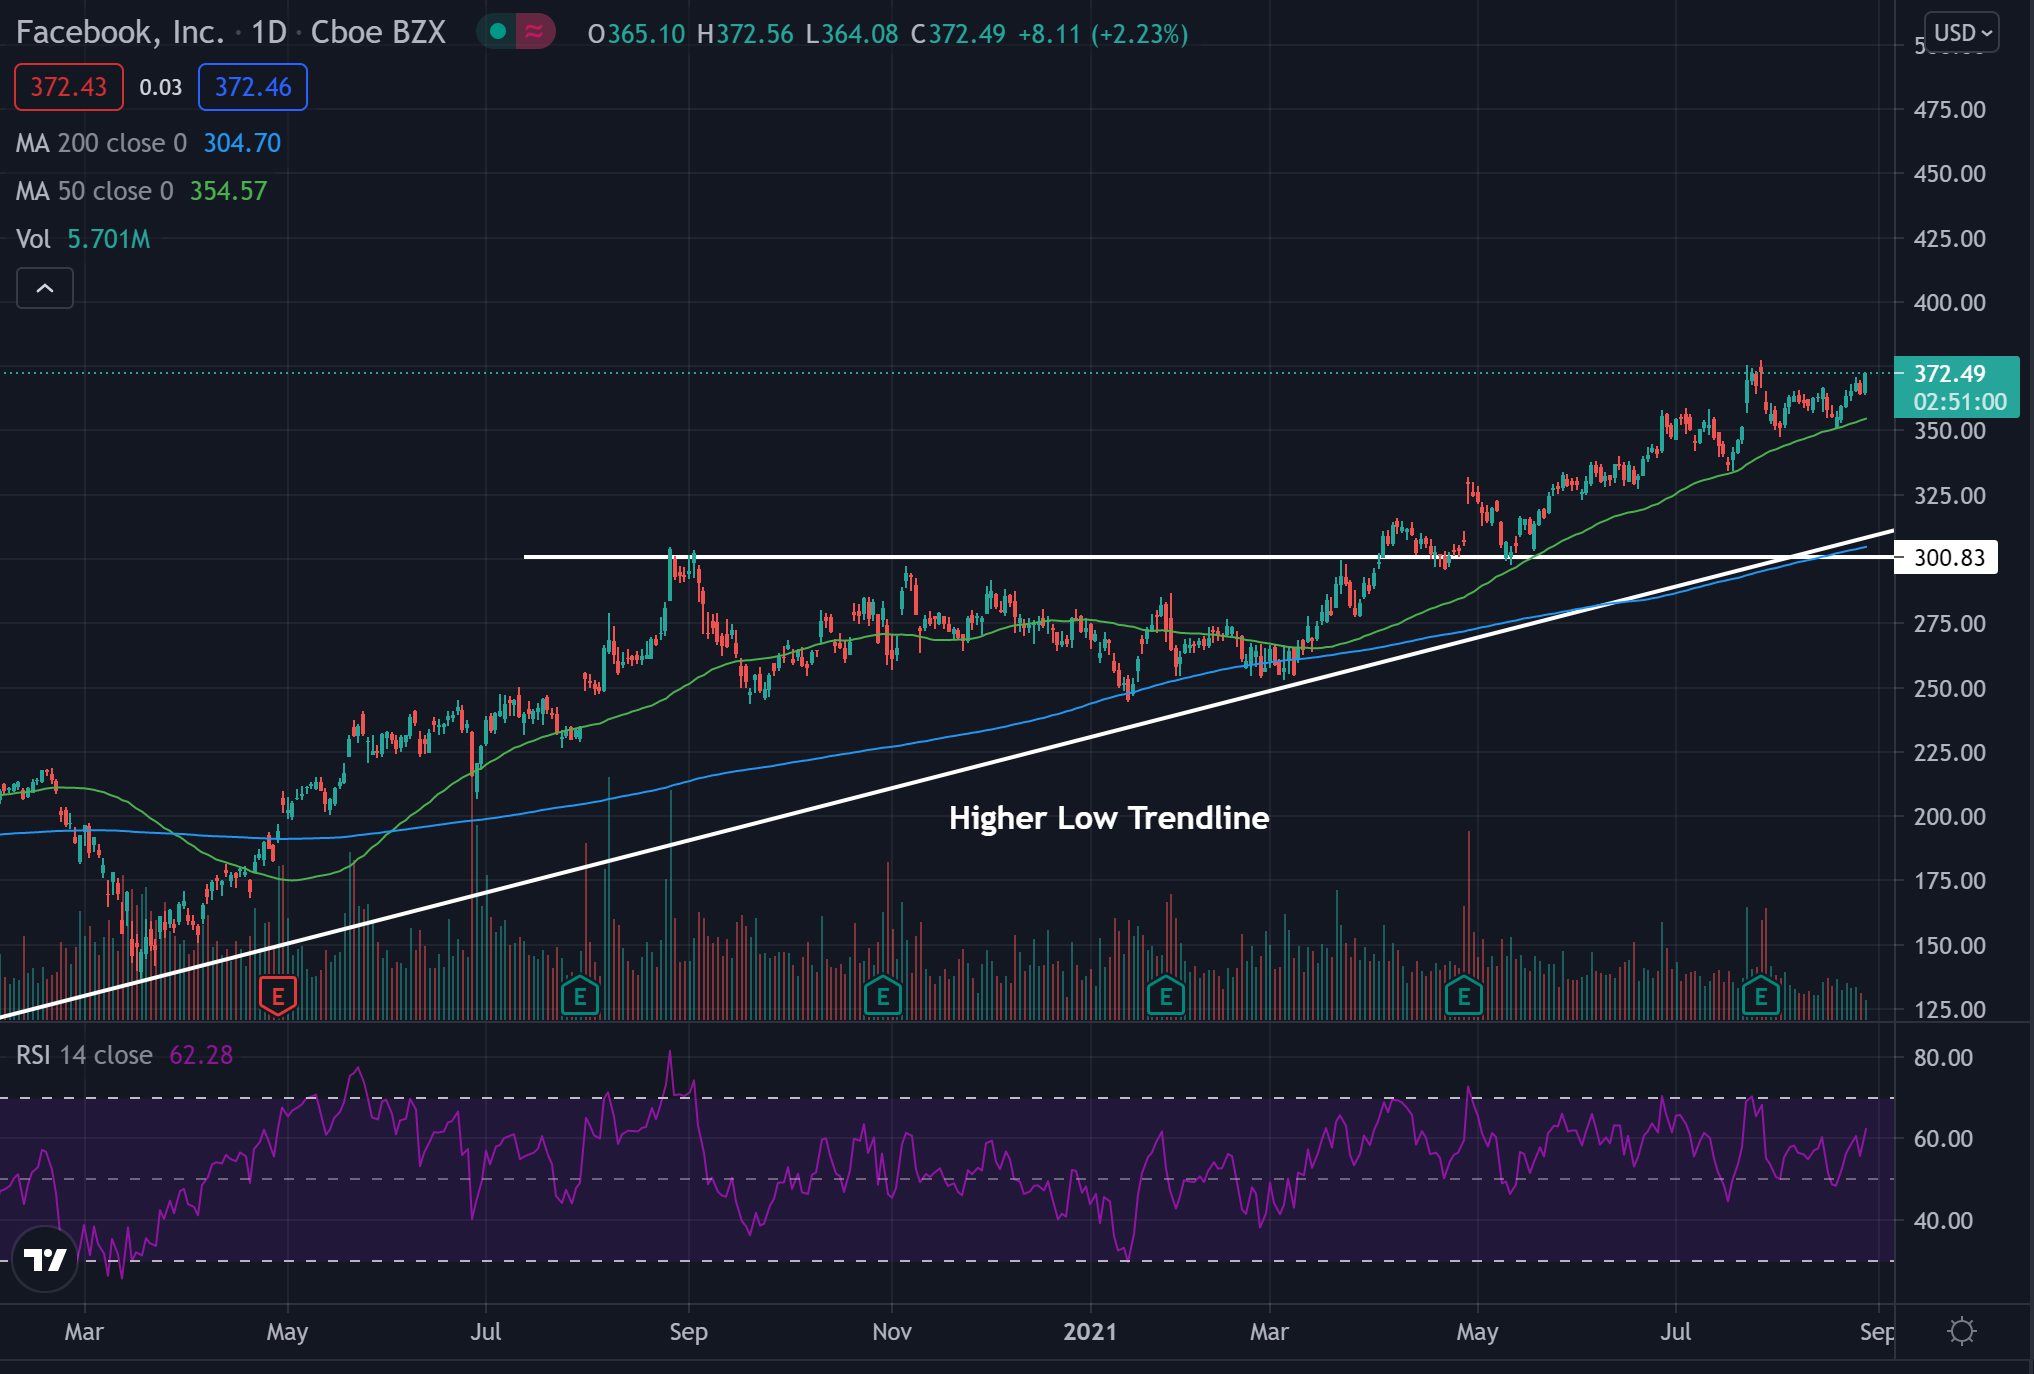
Facebook Inc. FB shares are trading higher Friday, continuing to push higher along the upward trendline.
The stock has broken out of a pattern and has been pushing higher since. The tech giant may stay bullish if it maintains holding above the trendline.
Facebook was up 2.12% at $372.12 at time of publication.
See Also: Twitter Stock Is Starting To Coil Up In A Pennant
Facebook Daily Chart Analysis
- The stock broke out of an ascending triangle pattern and has been pushing up higher past the higher low trendline.
- The $300 price level held as resistance in the past, but became support after the stock broke out above the level, retested the area as support and was able to hold. The stock may continue to find support along the higher low trendline.
- The stock trades above both the 50-day moving average (green), and the 200-day moving average (blue), indicating the stock is likely facing a period of bullish sentiment.
- Each of these moving averages may hold as a potential area of support in the future.
- The Relative Strength Index (RSI) has been moving sideways above the middle line and sits at 62. This means there has been steadily more buying pressure than selling pressure in the stock.

What’s Next For Facebook?
Bullish traders are looking to see the stock continue to trade above the higher low trendline and stay on the uptrend it has been on. Bulls have held control in the stock and may continue to if the stock stays above this trendline.
Bearish traders would like to see the stock fall below the higher low trendline and be able to hold below it. A break below this trendline could signal the start of a downward trend.
© 2025 Benzinga.com. Benzinga does not provide investment advice. All rights reserved.
Trade confidently with insights and alerts from analyst ratings, free reports and breaking news that affects the stocks you care about.