Tesla Inc TSLA CEO Elon Musk sent a company-wide email on Sept. 8 asking employees to "go super hardcore’ in an effort to motivate the workers to meet delivery targets for the third quarter. The electric vehicle manufacturer, like many automakers, has been negatively impacted by the global chip shortage.
For the second quarter of 2021, Tesla delivered a record number of vehicles but the company has had to send out vehicles with missing or alternative parts and a promise to install or replace the components when new parts become available.
Despite the struggles, Musk wants the largest delivery push in Tesla’s history.
On Monday, options traders sold a slew of Tesla call contracts when the markets opened, likely due to the monthly options expiry coming up this Friday. Over the coming days, traders will want to see whether institutions roll their calls out or if an increasing amount of put contracts are purchased, which could signal further downside is expected.
See Also: Why The Tesla Bot Is The Key To A Mars Colony
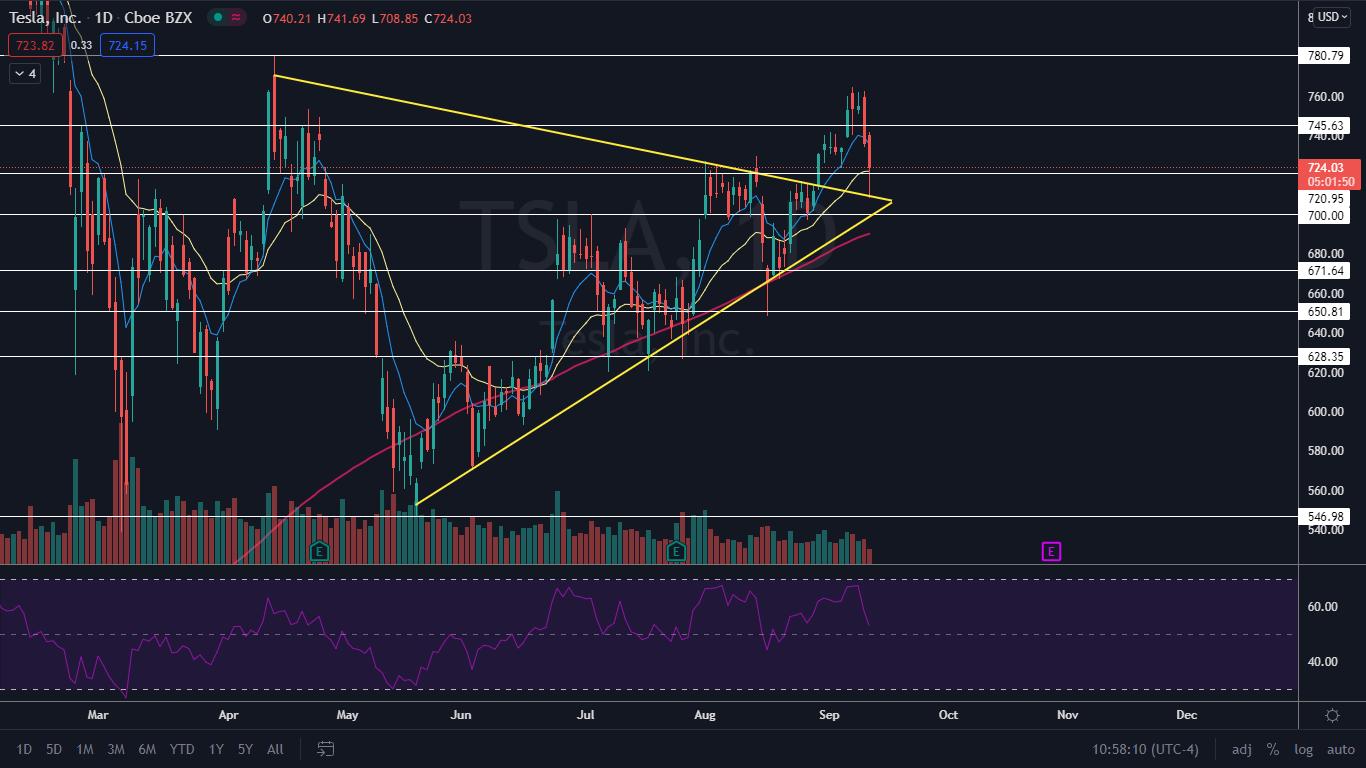
The Tesla Chart: Tesla’s stock fell straight through a support level at the $720 mark Monday morning and backtested and wicked from the descending trendline of a triangle the stock broke up from on Aug. 30. When a stock backtests and bounces from a pattern the formation gains validity.
On Sept. 9, Tesla’s relative strength index reached 67% which indicated consolidation was needed on the daily chart. When Tesla reached the same level on Aug. 5 the stock retraced 10% over the following seven trading days. When a stock’s RSI nears or exceeds 70% it enters overbought territory which is often a sell signal for technical traders.
Tesla is trading in line with the 21-day exponential moving average (EMA) but below the eight-day EMA with the eight-day EMA trending above the 21-day, which indicates indecision. The stock is trading above the 200-day simple moving average, which is bullish.
- Bulls want to see Tesla continue to consolidate sideways with low volume and for the stock to remain above the triangle pattern. Tesla has resistance at $745 and $780.
- Bears want to see sustained bearish volume drive Tesla down below the descending trendline of the pattern. If Tesla’s stock loses the trendline as support it could fall toward the $700 level and below that there is another support area at $671.

Photo: Courtesy Tesla Inc.
© 2024 Benzinga.com. Benzinga does not provide investment advice. All rights reserved.
Comments
Trade confidently with insights and alerts from analyst ratings, free reports and breaking news that affects the stocks you care about.