Advanced Micro Devices Inc. AMD and NVIDIA Corporation NVDA are two microchip stocks trading slightly lower Wednesday as the market for chipmakers is moving up. These two stocks are looking to either bounce at support and head higher or break below support and start heading lower.
AMD was down 0.33% at $101.19 and NVIDIA was down 0.0097% at $206.99 at publication Wednesday afternoon.
AMD Daily Chart Analysis
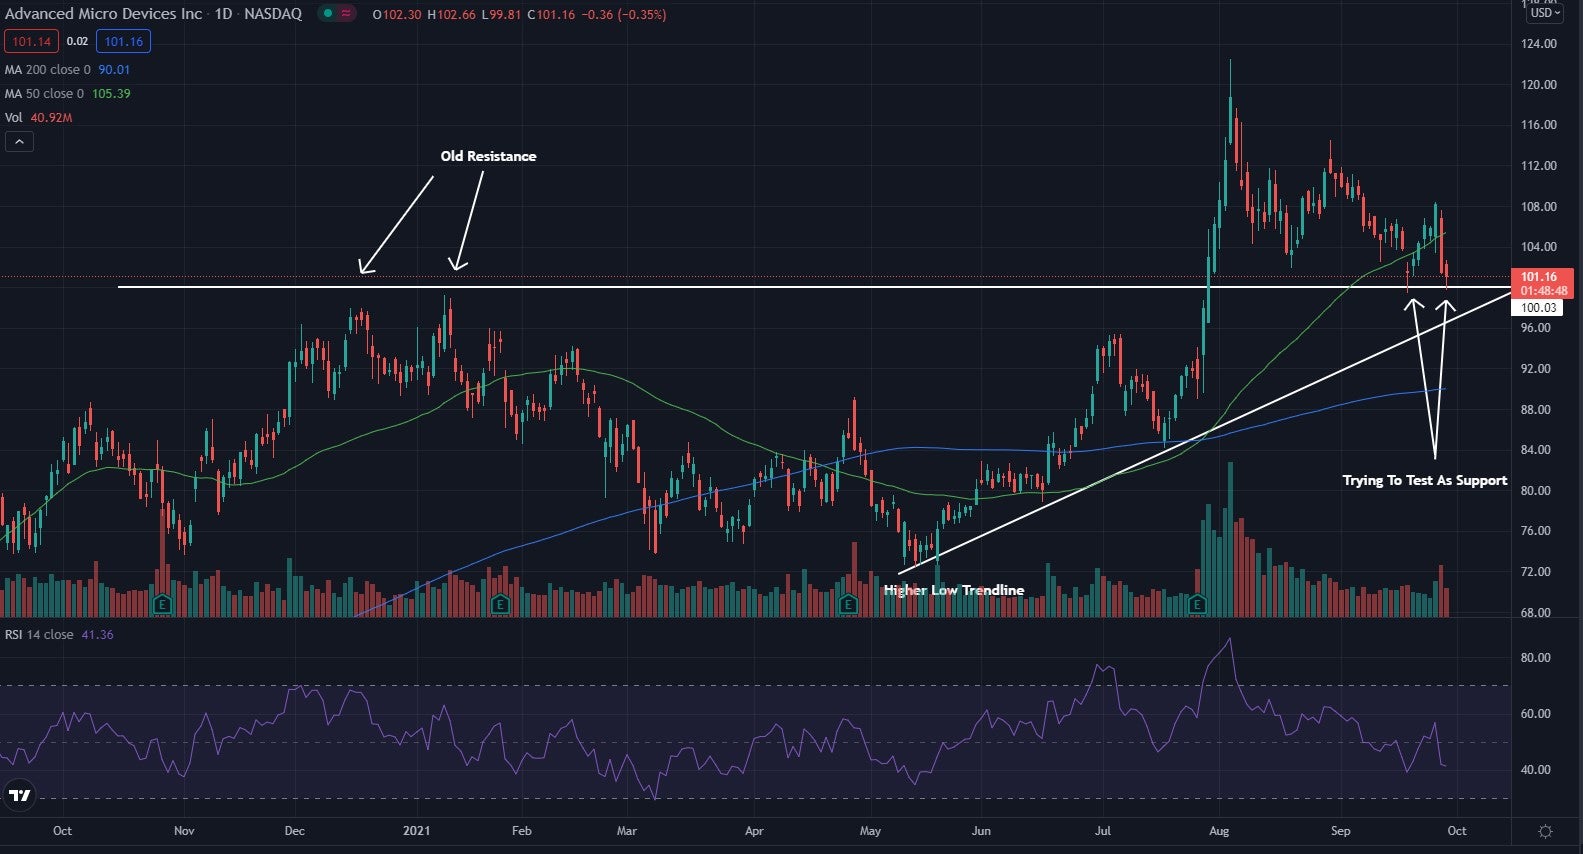
- AMD was able to break out of an ascending triangle pattern and is now testing the old resistance level as a possible area of support.
- Resistance was found near the $100 level before the price broke above, this level then went on to hold as support a couple of times and is testing the area again. If unable to hold, the higher low trendline is another place the stock could find support near.
- The stock trades below the 50-day moving average (green) but above the 200-day moving average (blue), indicating the stock is likely in a period of consolidation.

NVIDIA Daily Chart Analysis
- NVIDIA trades in a similar situation as AMD, recently broke above an ascending triangle, but now looks to be falling below both the old resistance and the higher low trendline.
- The $210 level is where NVIDIA found resistance in the pattern, but it then broke above the level and is still trying to hold level as support. The stock is trying to bounce at this area as the higher low trendline and the $210 level are crossing.
- The stock trades below the 50-day moving average (green) but above the 200-day moving average (blue), indicating the stock is possibly trading in a period of consolidation.

Which Stock Looks More Bullish?
The stocks are in the same sector meaning they will likely follow each other pretty closely. Both stocks are trading in the same pattern, but AMD looks to be attempting to bounce at the previous resistance level while NVIDIA looks to be falling below both the previous resistance and the higher low trendline. This shows the AMD chart looks to be more bullish at the end of September.
Photo by 2 Bull Photography on Unsplash
© 2025 Benzinga.com. Benzinga does not provide investment advice. All rights reserved.
Trade confidently with insights and alerts from analyst ratings, free reports and breaking news that affects the stocks you care about.